


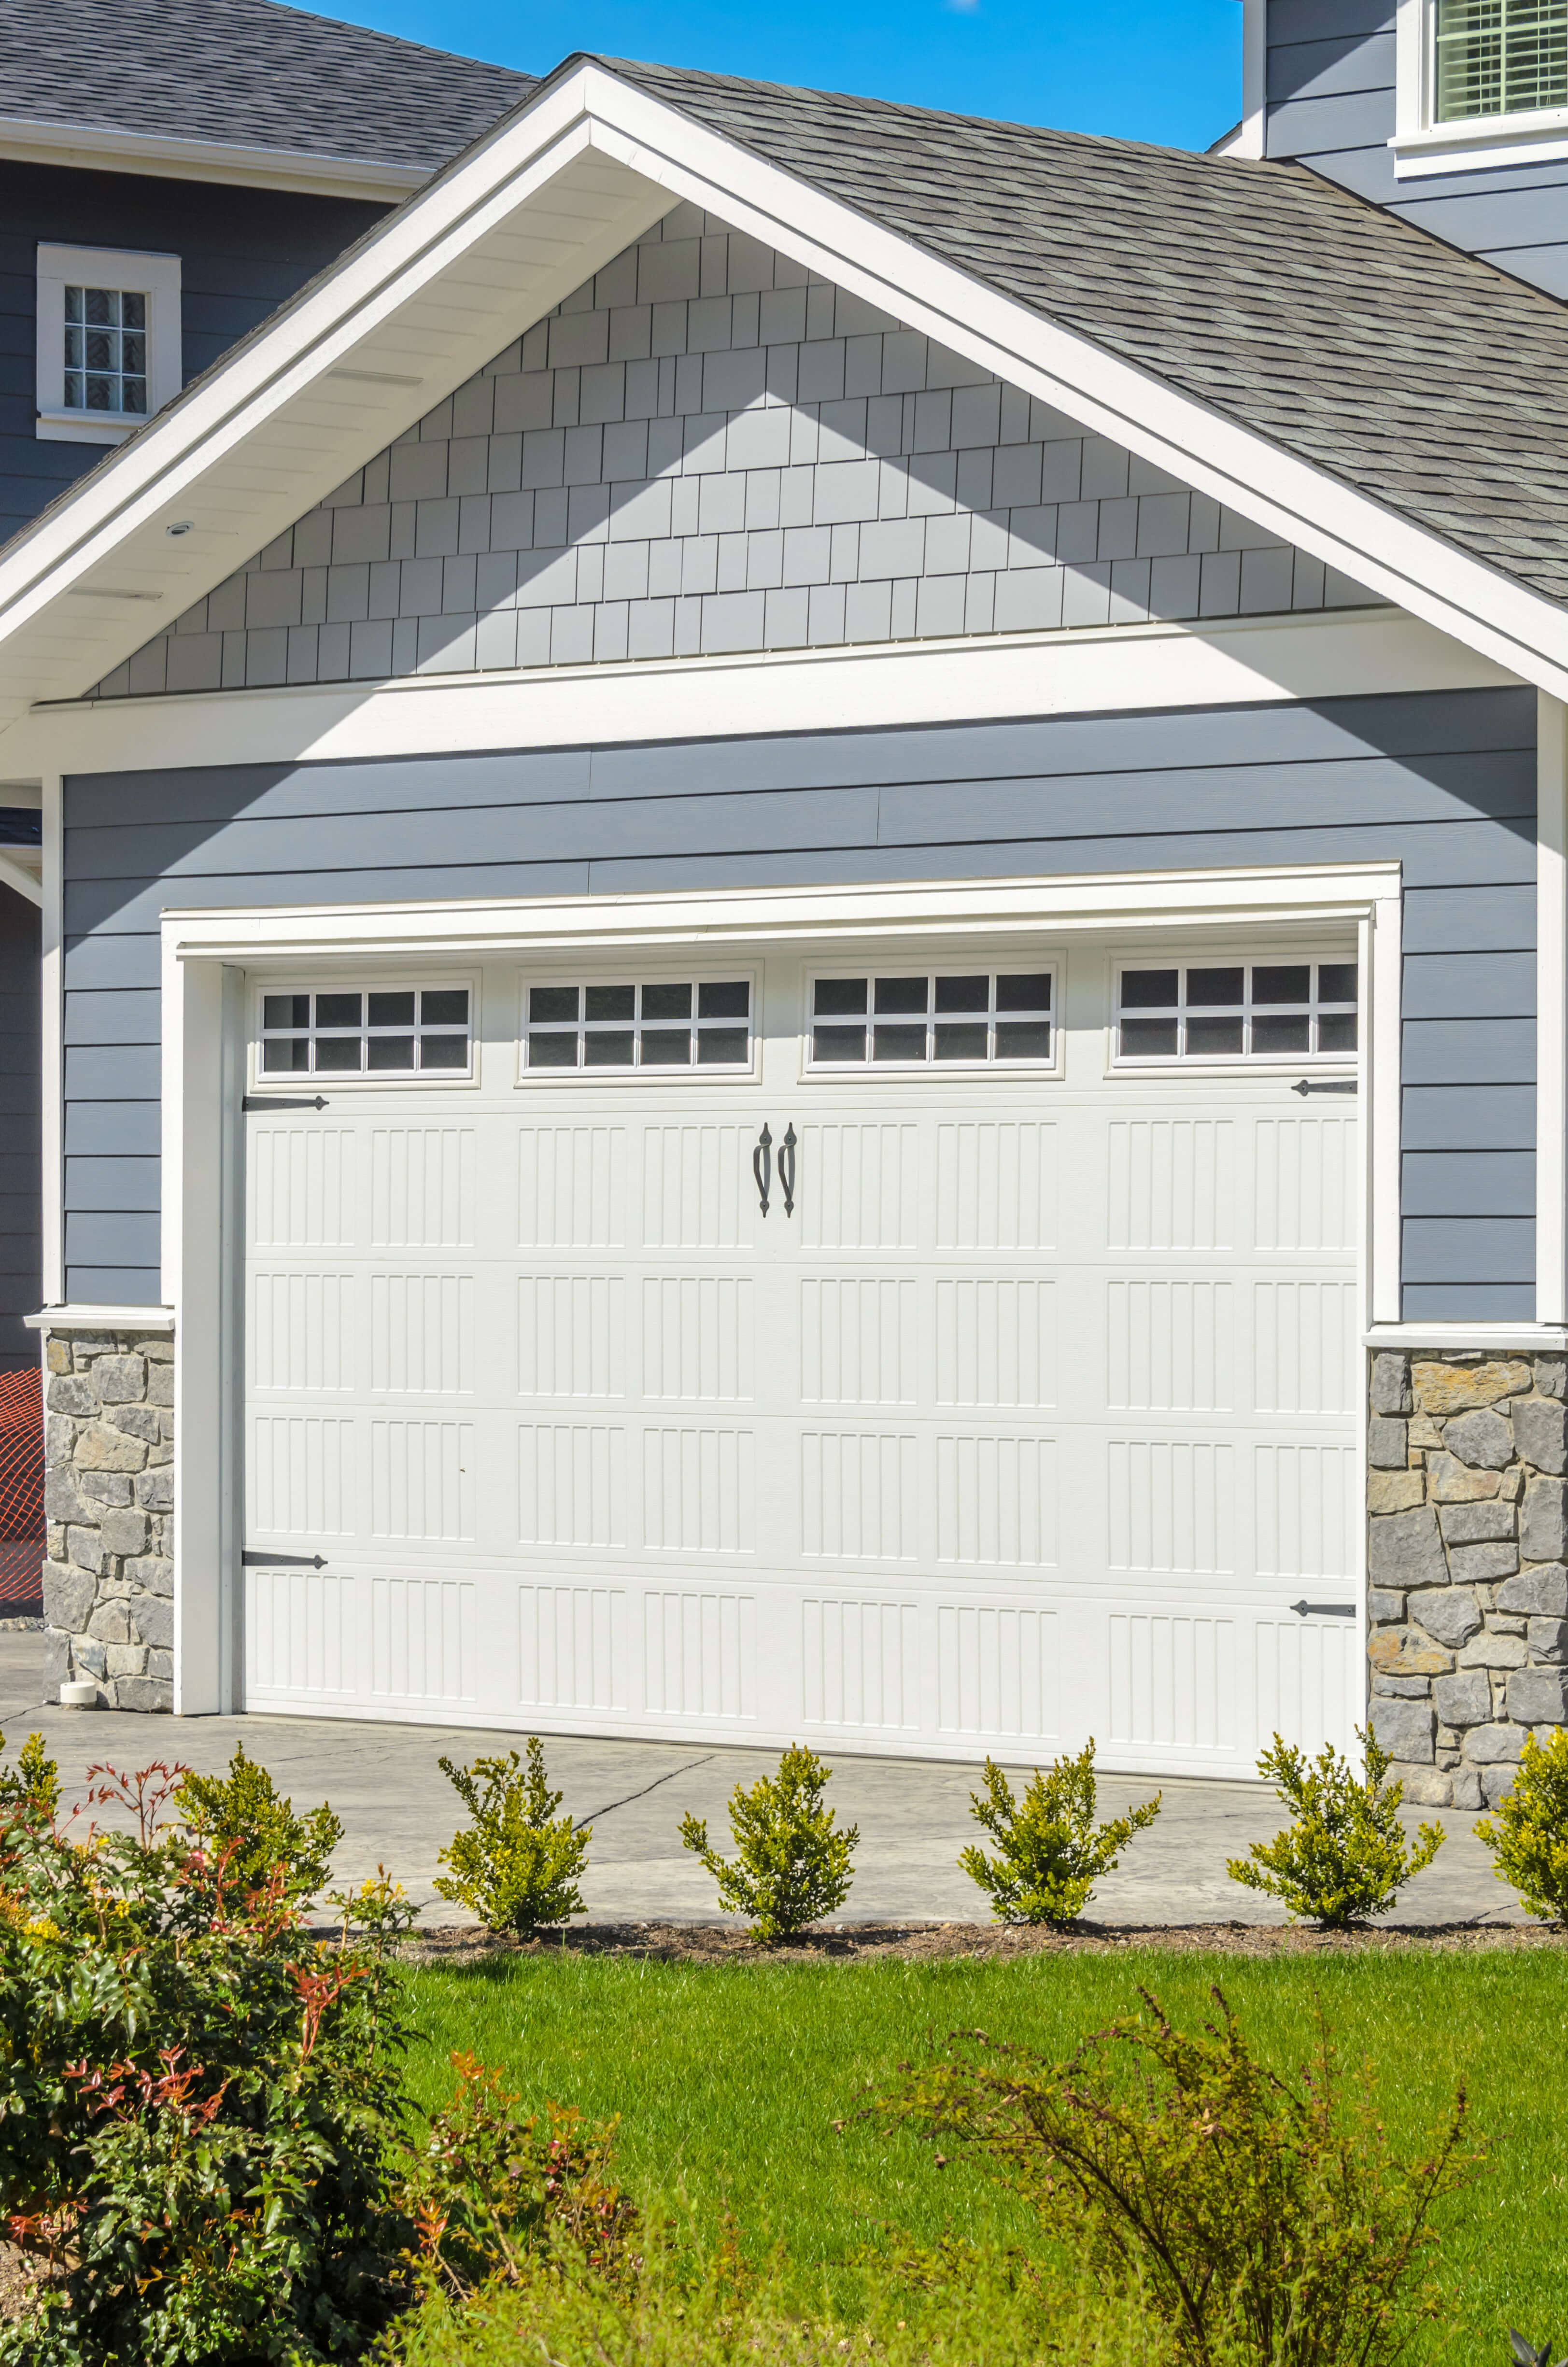
Replacing an existing garage door with a higher-quality, two-car insulated garage door with windows. This inexpensive project has the highest return on investment (ROI) of the 34 home renovations we reviewed.
Cost
$0
Value
$0
Cost Recovered
0%

The homeowner's guide to home improvement costs and values.
Your home is your biggest financial investment, but what are the smartest ways to invest in it? Today's Homeowner determined the average return on investment (ROI) for 34 home remodeling projects across 1200+ U.S. markets. For each project, we calculated the average cost, expected value added to the home, and the percentage of the project cost recovered, which we call the ROI.


| Project | Cost | Value | Cost Recovered |
|---|---|---|---|
| Garage Door Replacement | $2,028 | $2,028 | 100.0% |
| Wood Window Replacement | $6,893 | $6,582 | 95.5% |
| Screened-In Porch Addition | $19,367 | $18,000 | 92.9% |
| Fiber-Cement Siding Replacement | $13,379 | $12,400 | 92.7% |
| Vinyl Siding Replacement | $9,227 | $8,400 | 91.0% |
| Vinyl Window Replacement | $3,941 | $3,550 | 90.1% |
| Inground Pool | $46,802 | $42,150 | 90.1% |
| Composite Deck Addition | $13,391 | $11,643 | 86.9% |
| Concrete Backyard Patio | $4,488 | $3,877 | 86.4% |
| Wood Deck Addition | $12,172 | $9,750 | 80.1% |
| Handicap Accessible Bathroom Remodel | $16,554 | $13,000 | 78.5% |
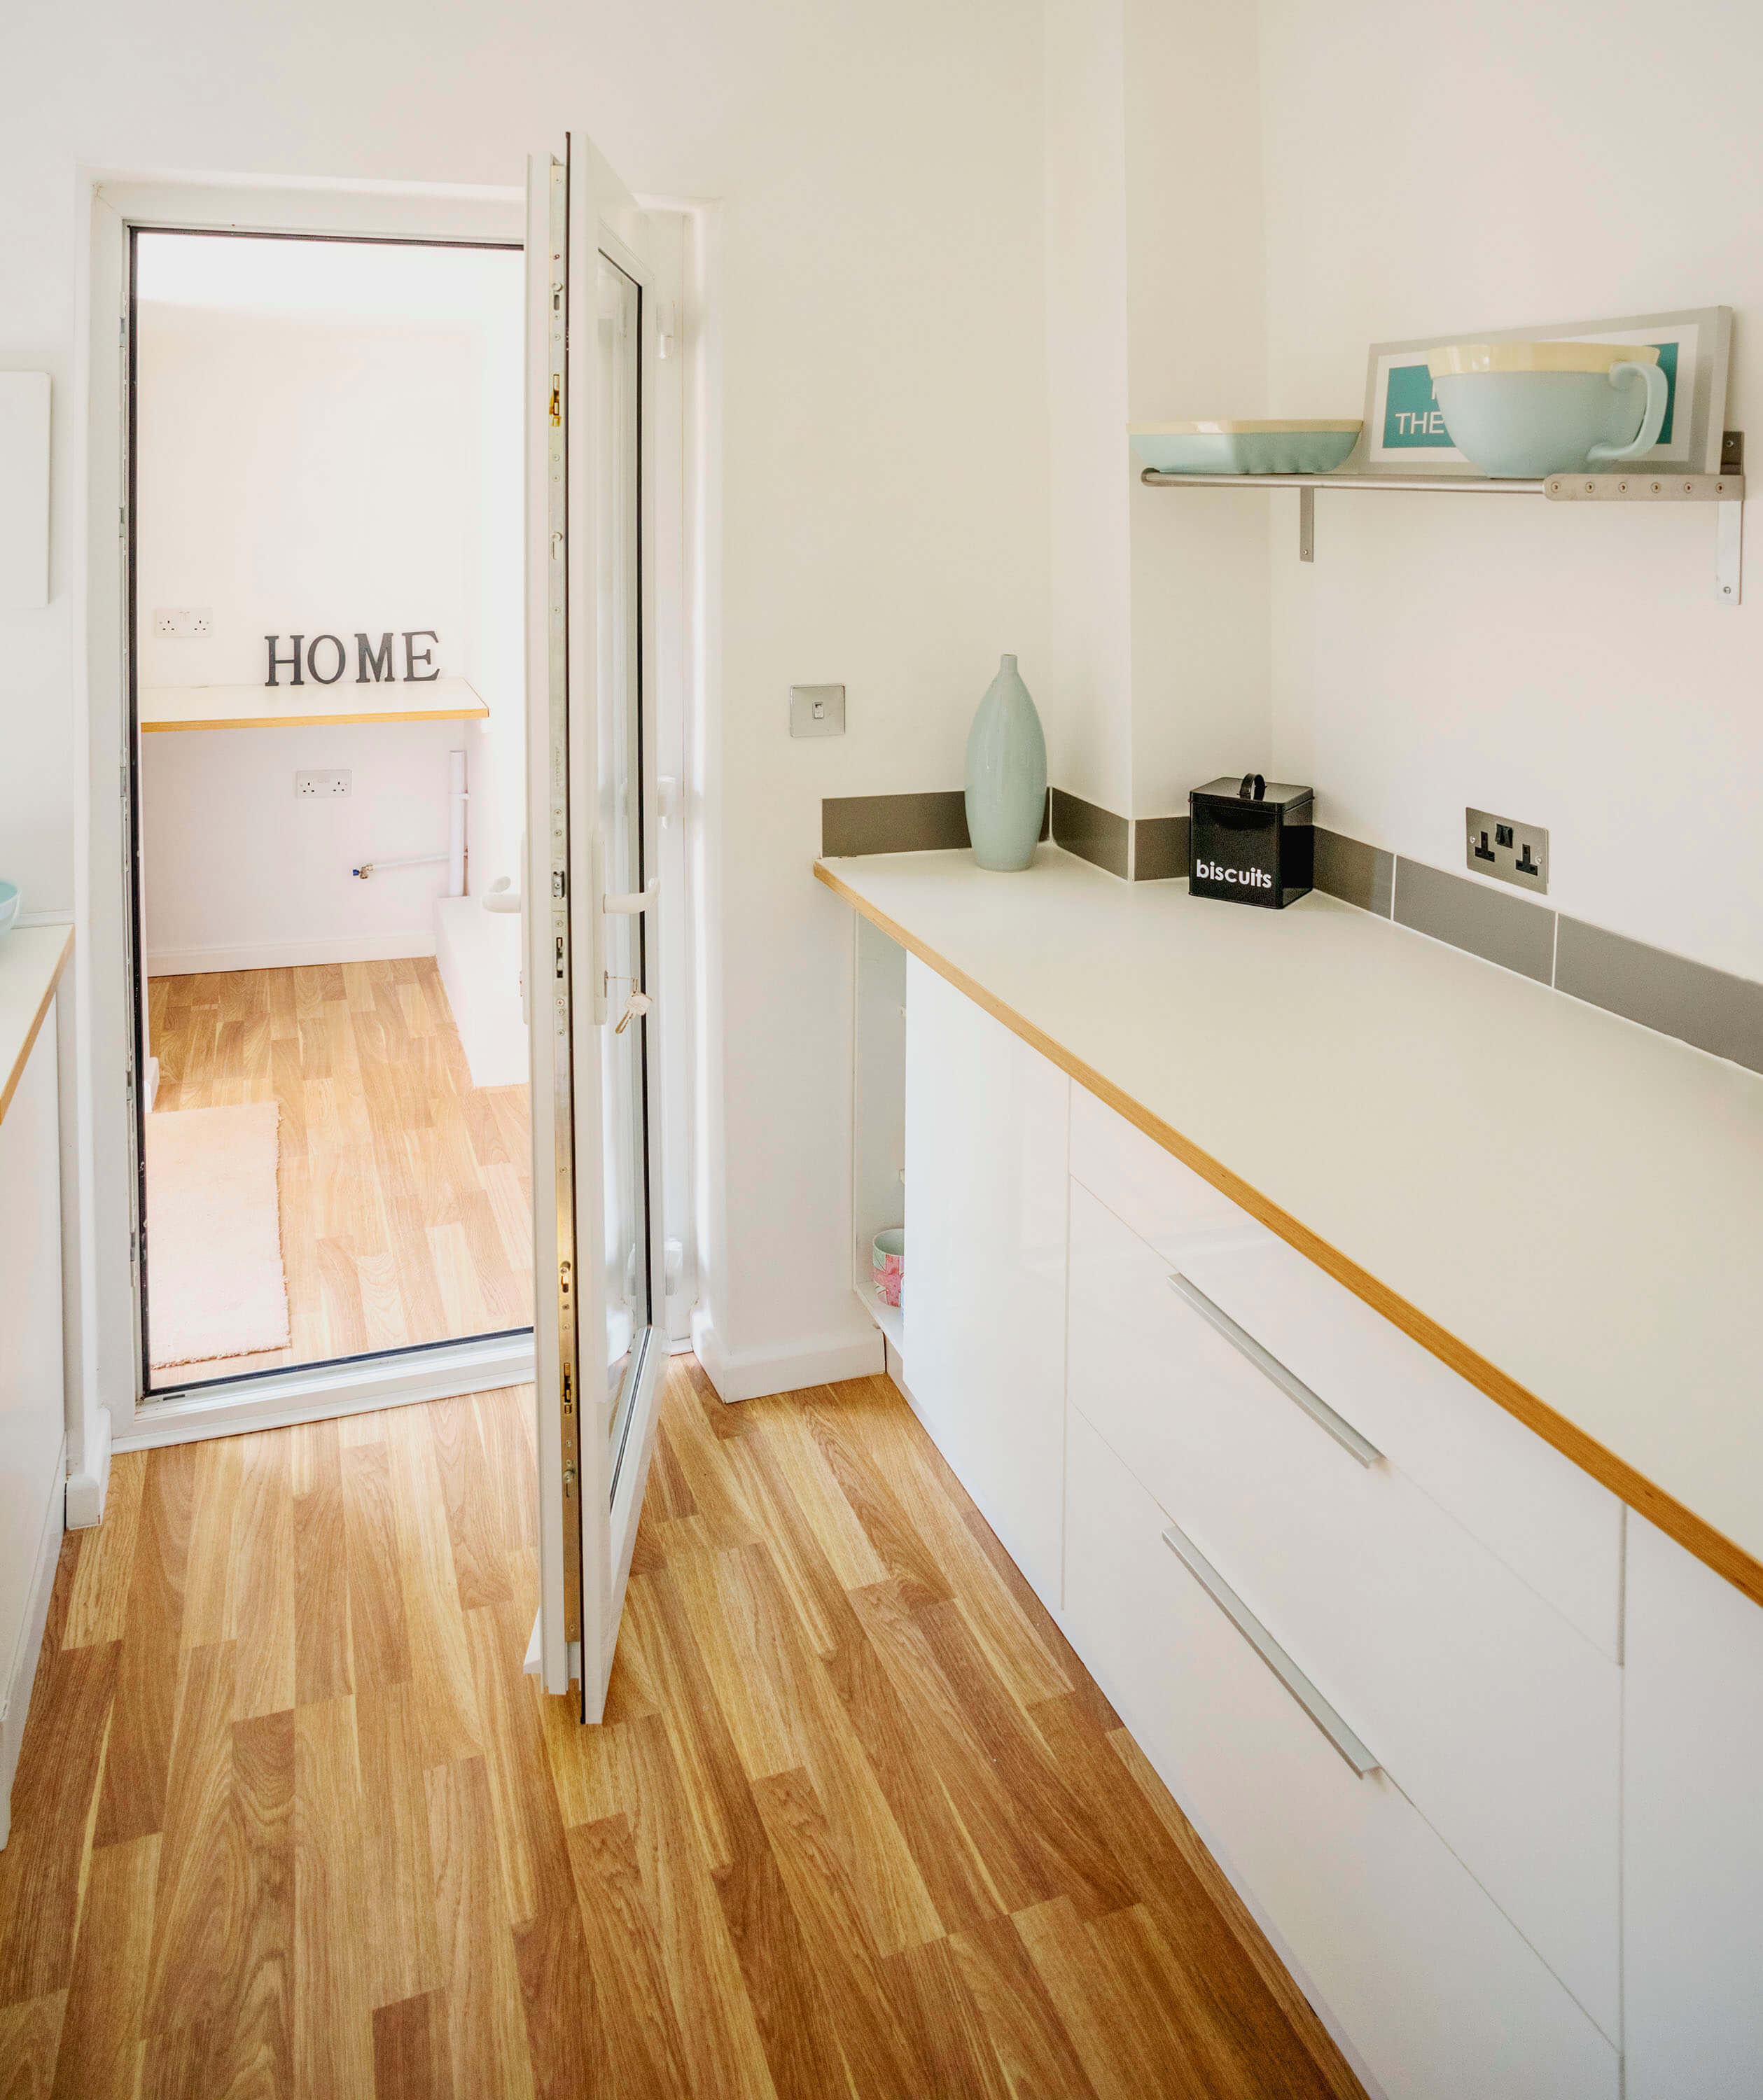
| Hardwood Flooring | $1,802 | $1,405 | 78.0% |
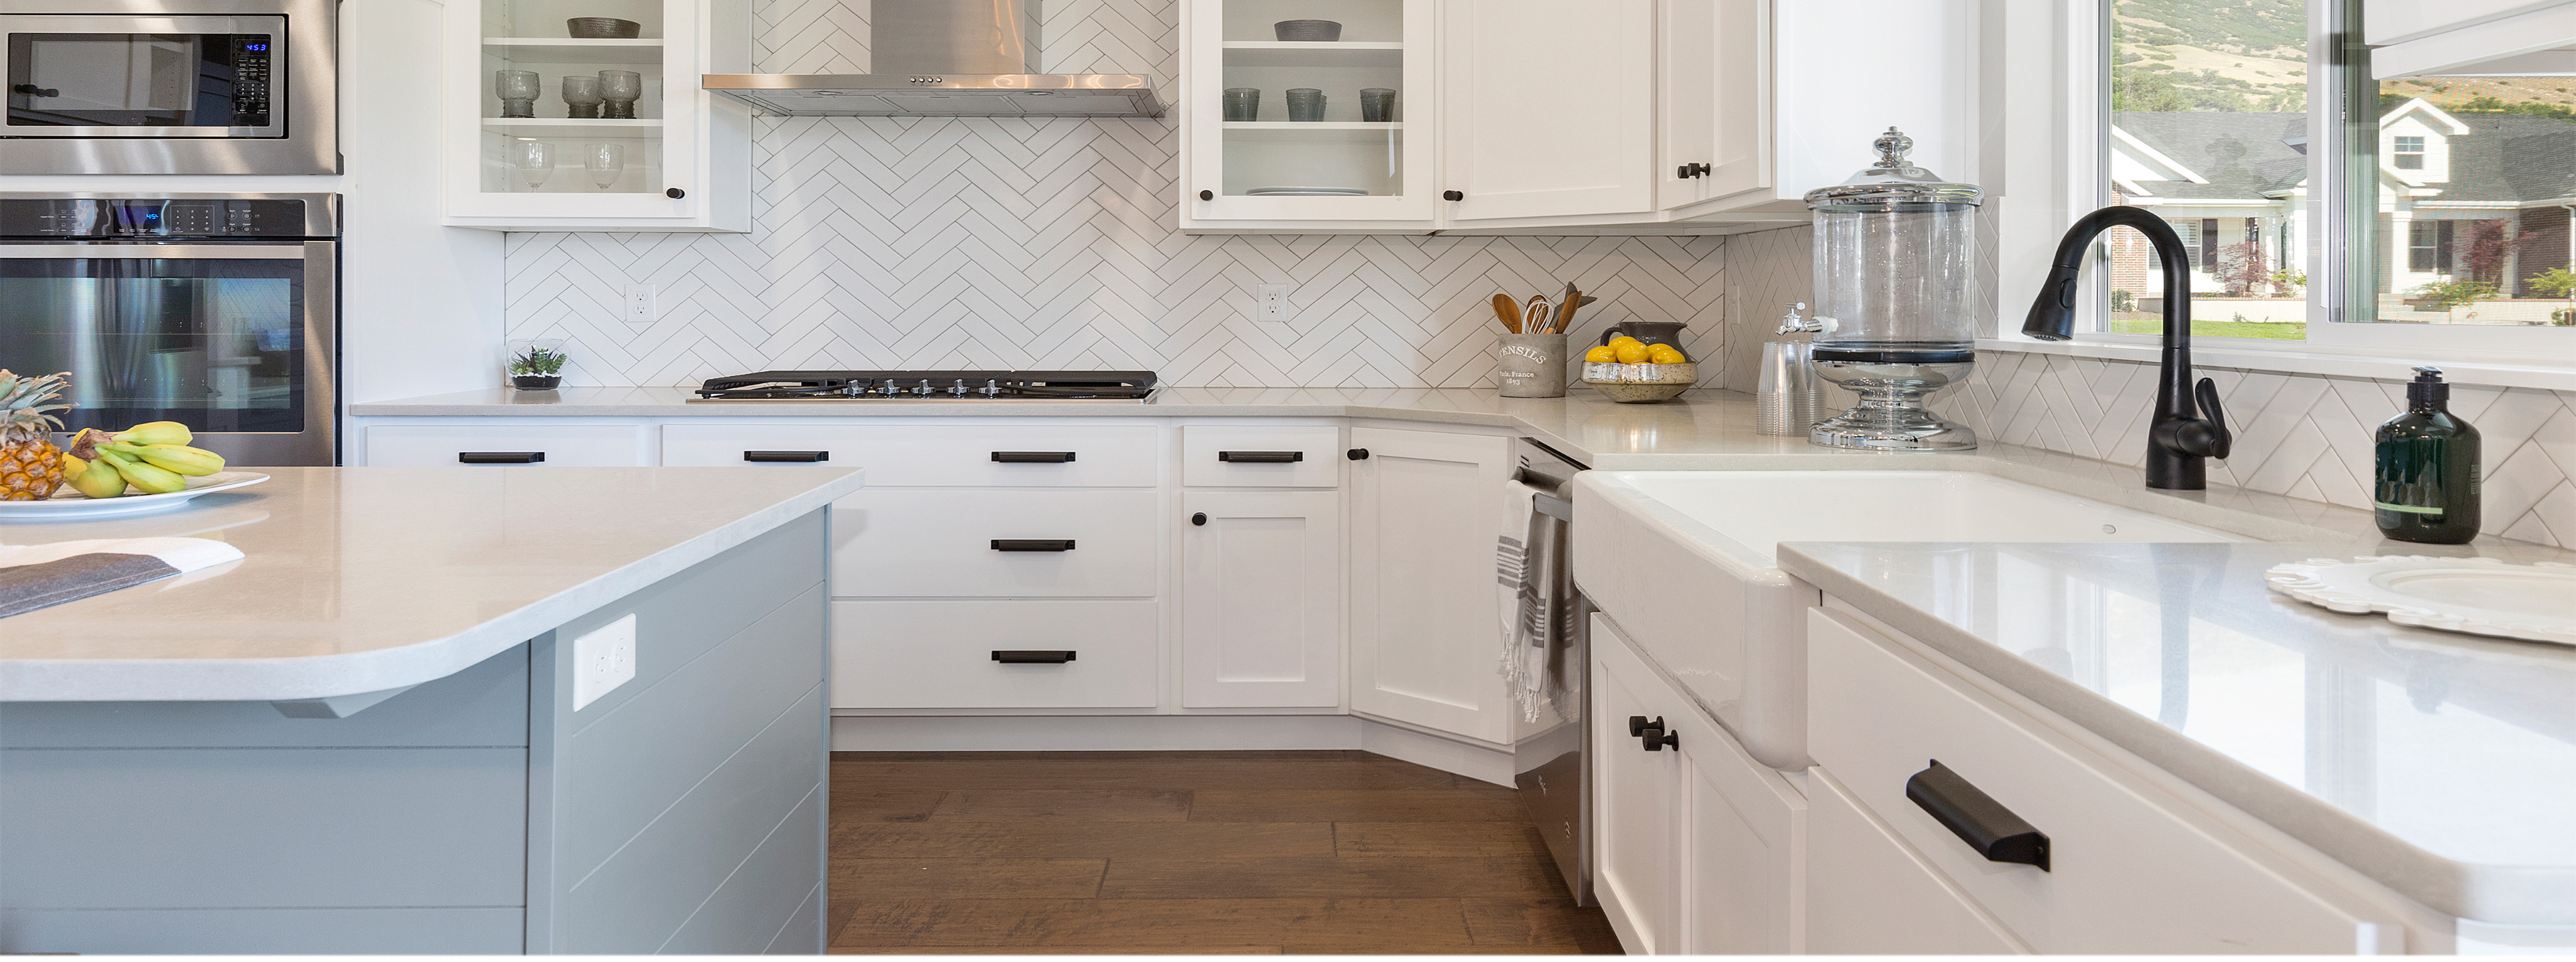
| Kitchen Appliances | $5,301 | $3,923 | 74.0% |
| Gutter Replacement | $2,795 | $2,050 | 73.3% |
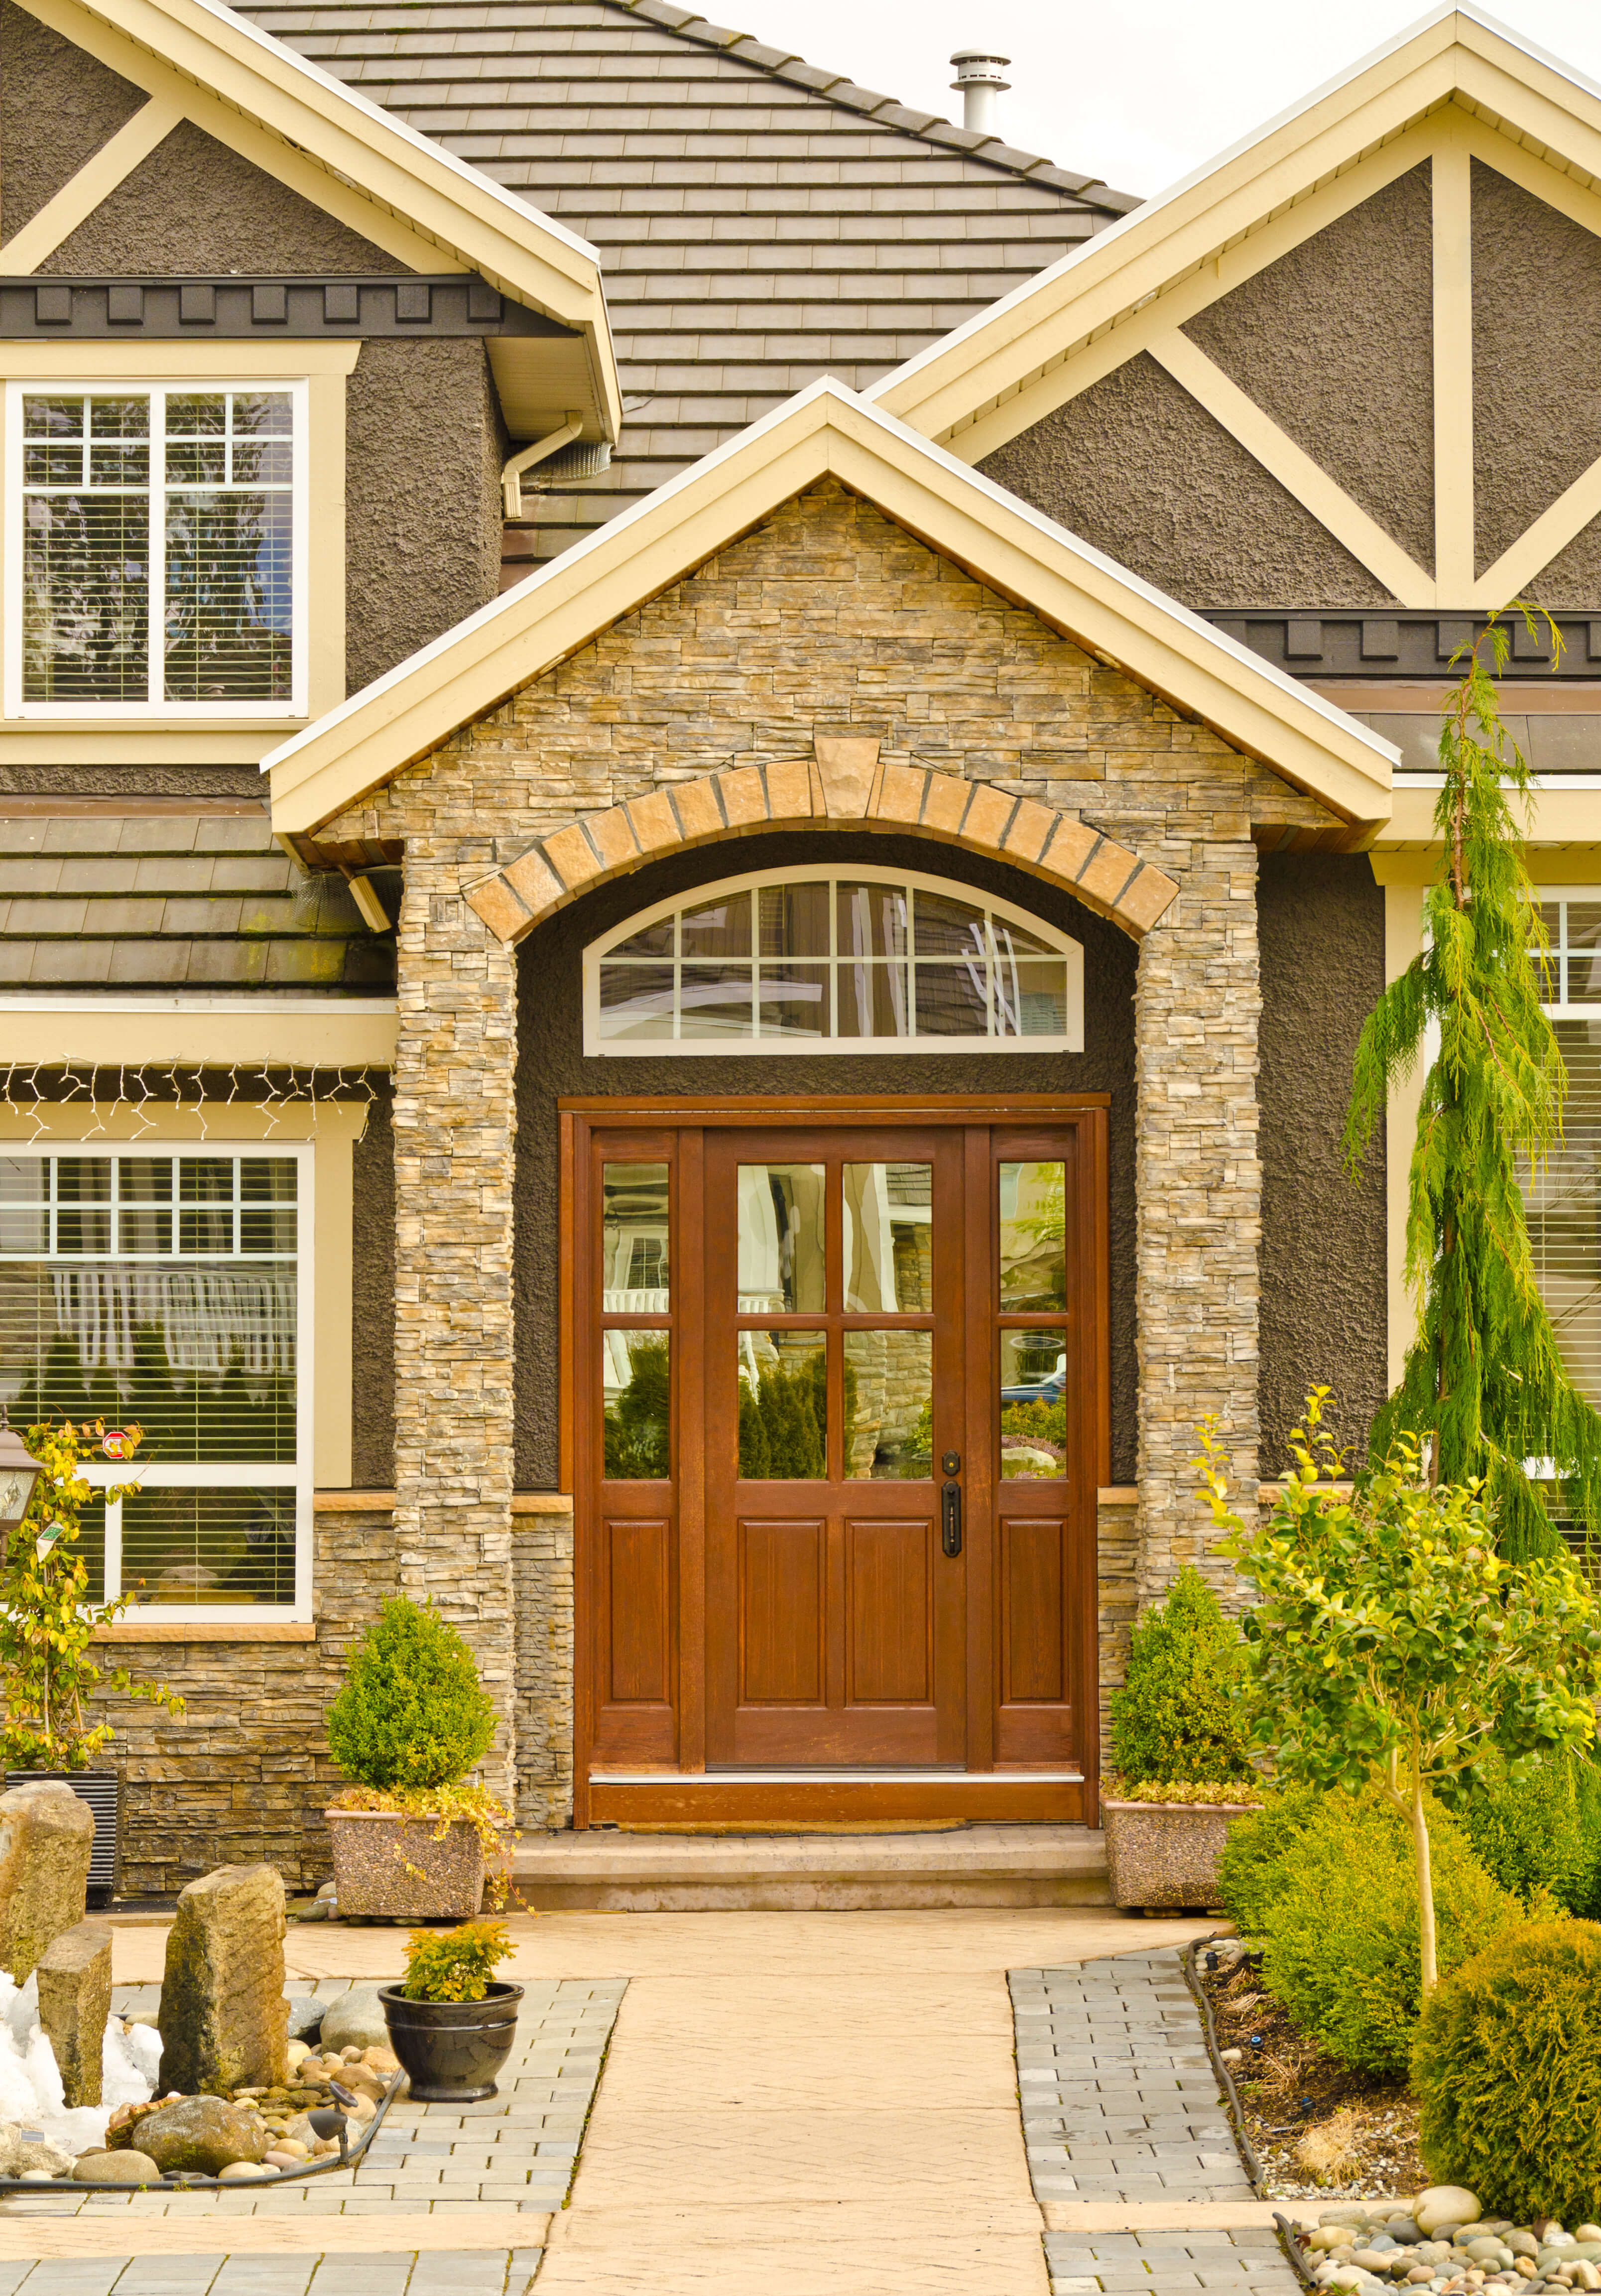
| Fiberglass Grand Entrance | $3,409 | $2,451 | 71.9% |
| Asphalt Roof Replacement | $10,053 | $7,150 | 71.1% |
| Metal Roof Replacement | $17,762 | $12,450 | 70.1% |
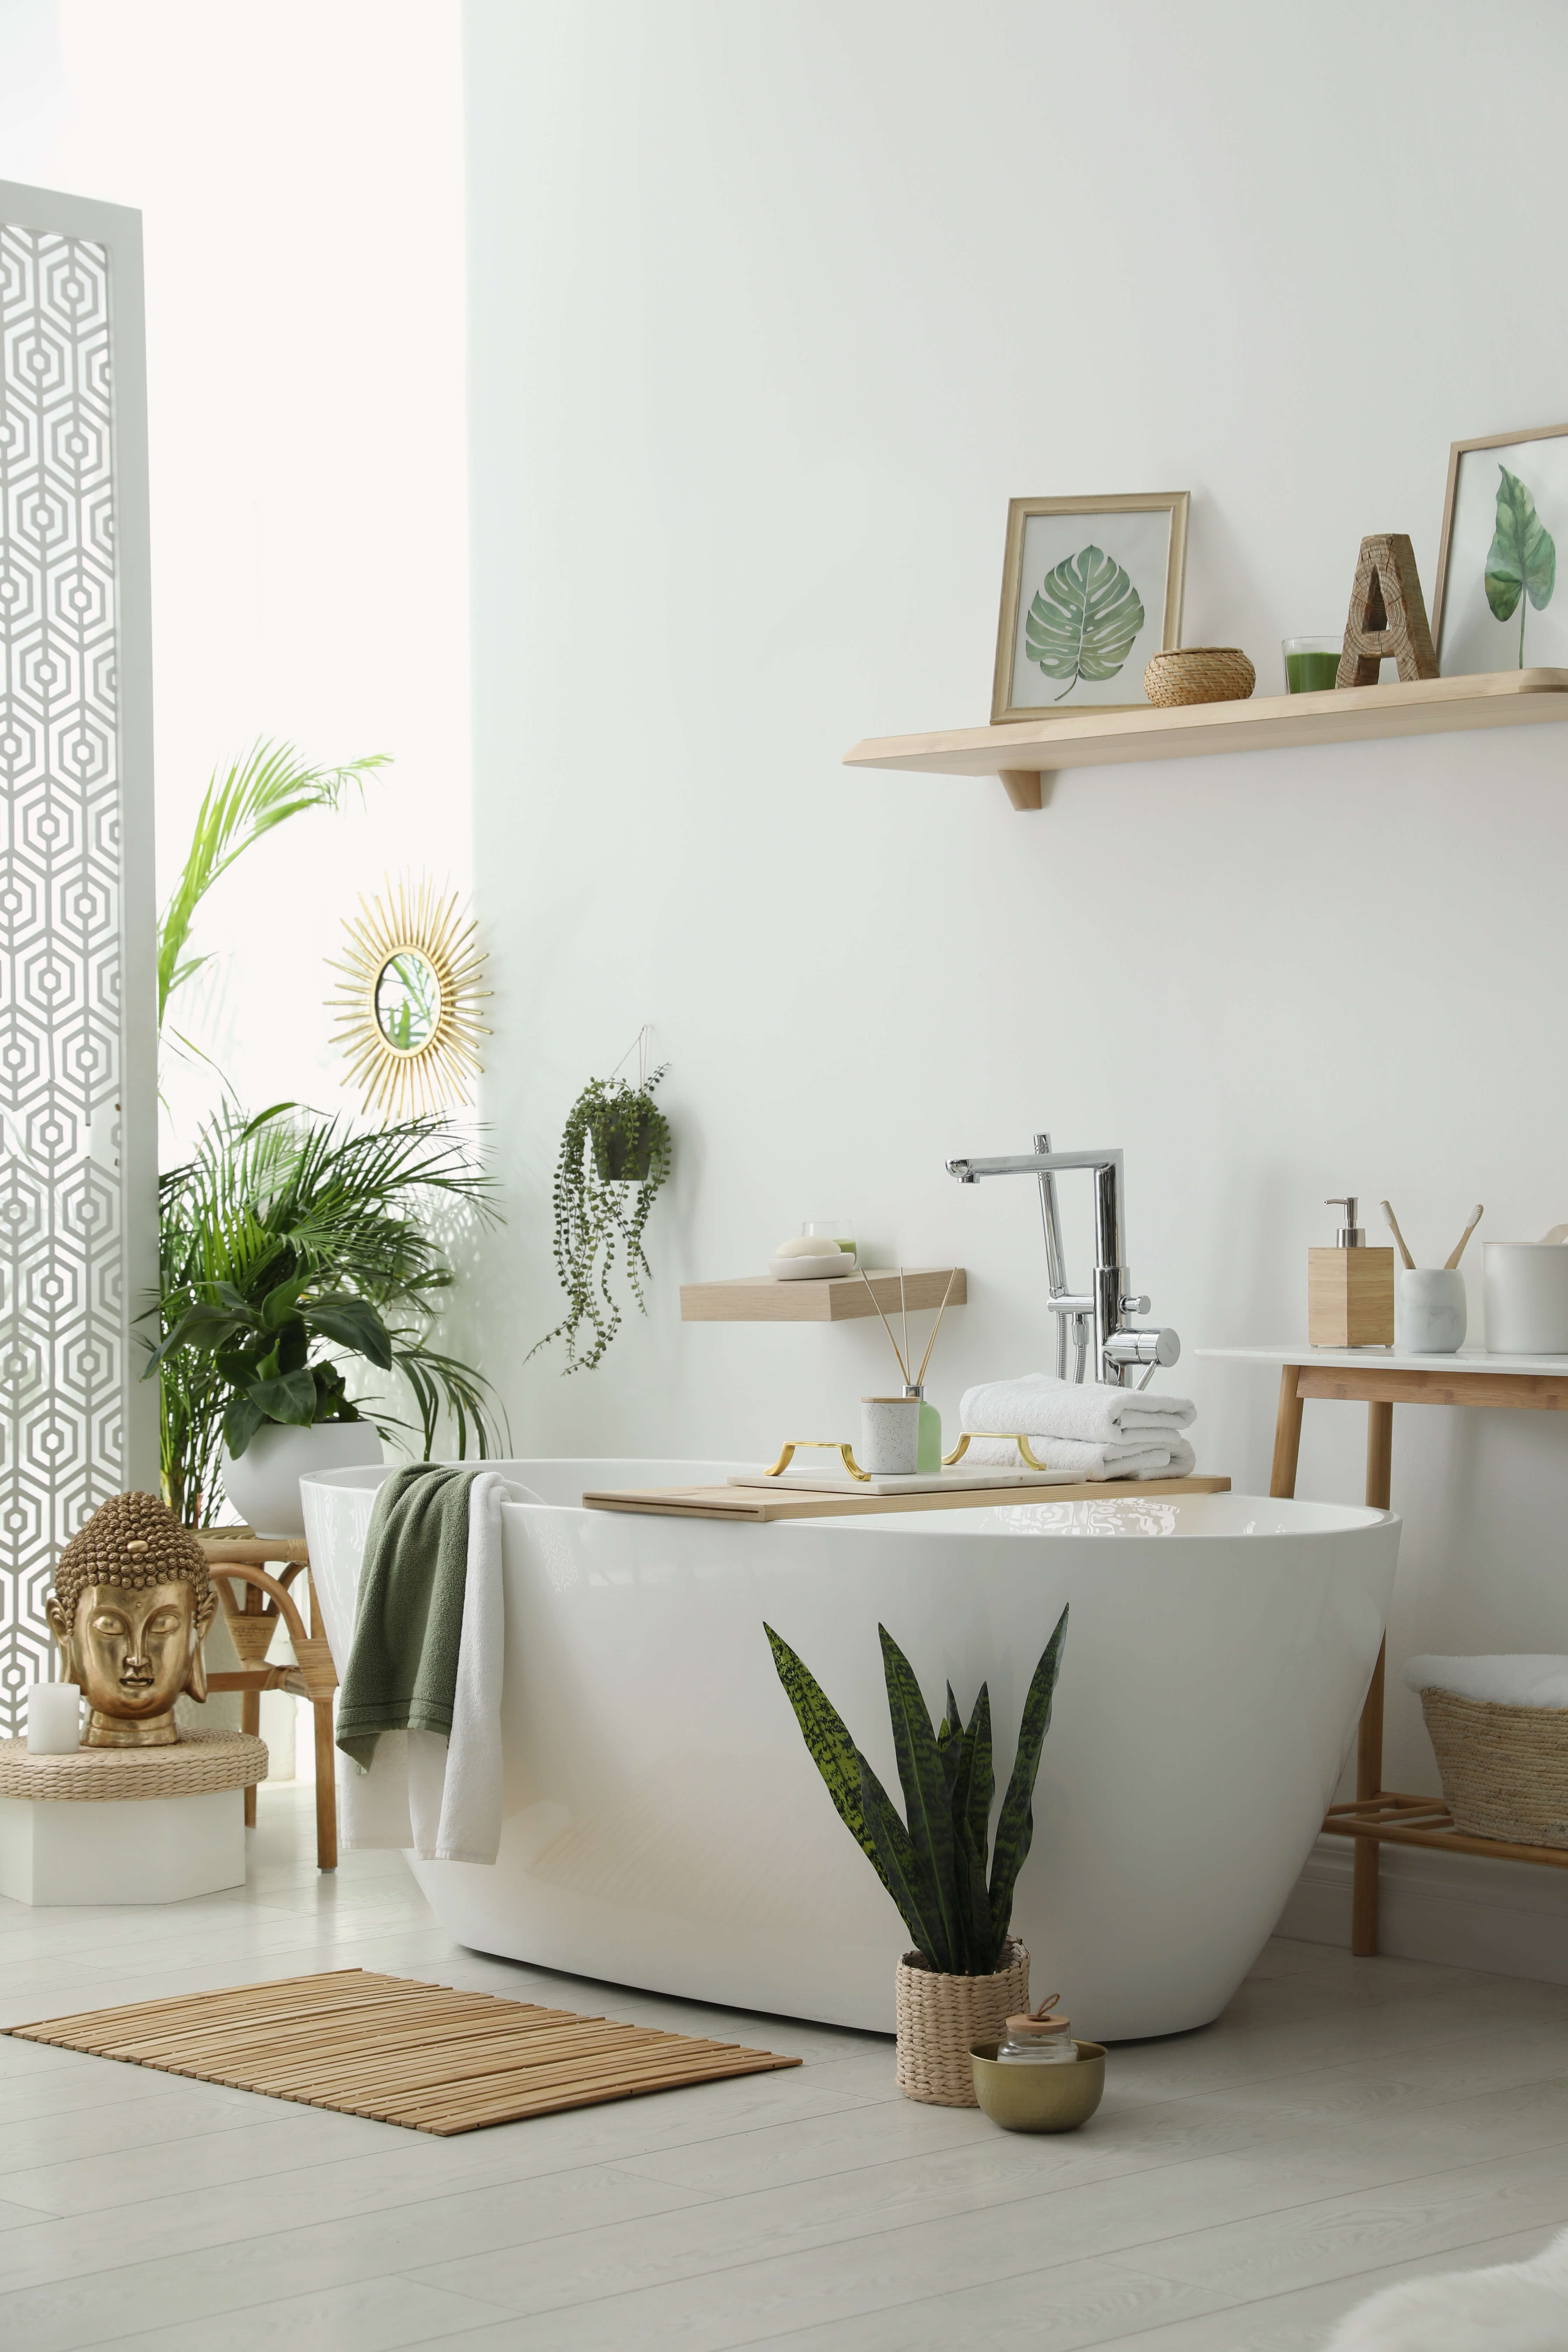
| Bathroom Addition Upscale | $74,882 | $48,020 | 64.1% |
| Quartz Kitchen Countertops | $8,087 | $5,014 | 62.0% |
| Granite Kitchen Countertops | $7,301 | $4,500 | 61.6% |
| Attached Garage Addition | $35,305 | $21,339 | 60.4% |
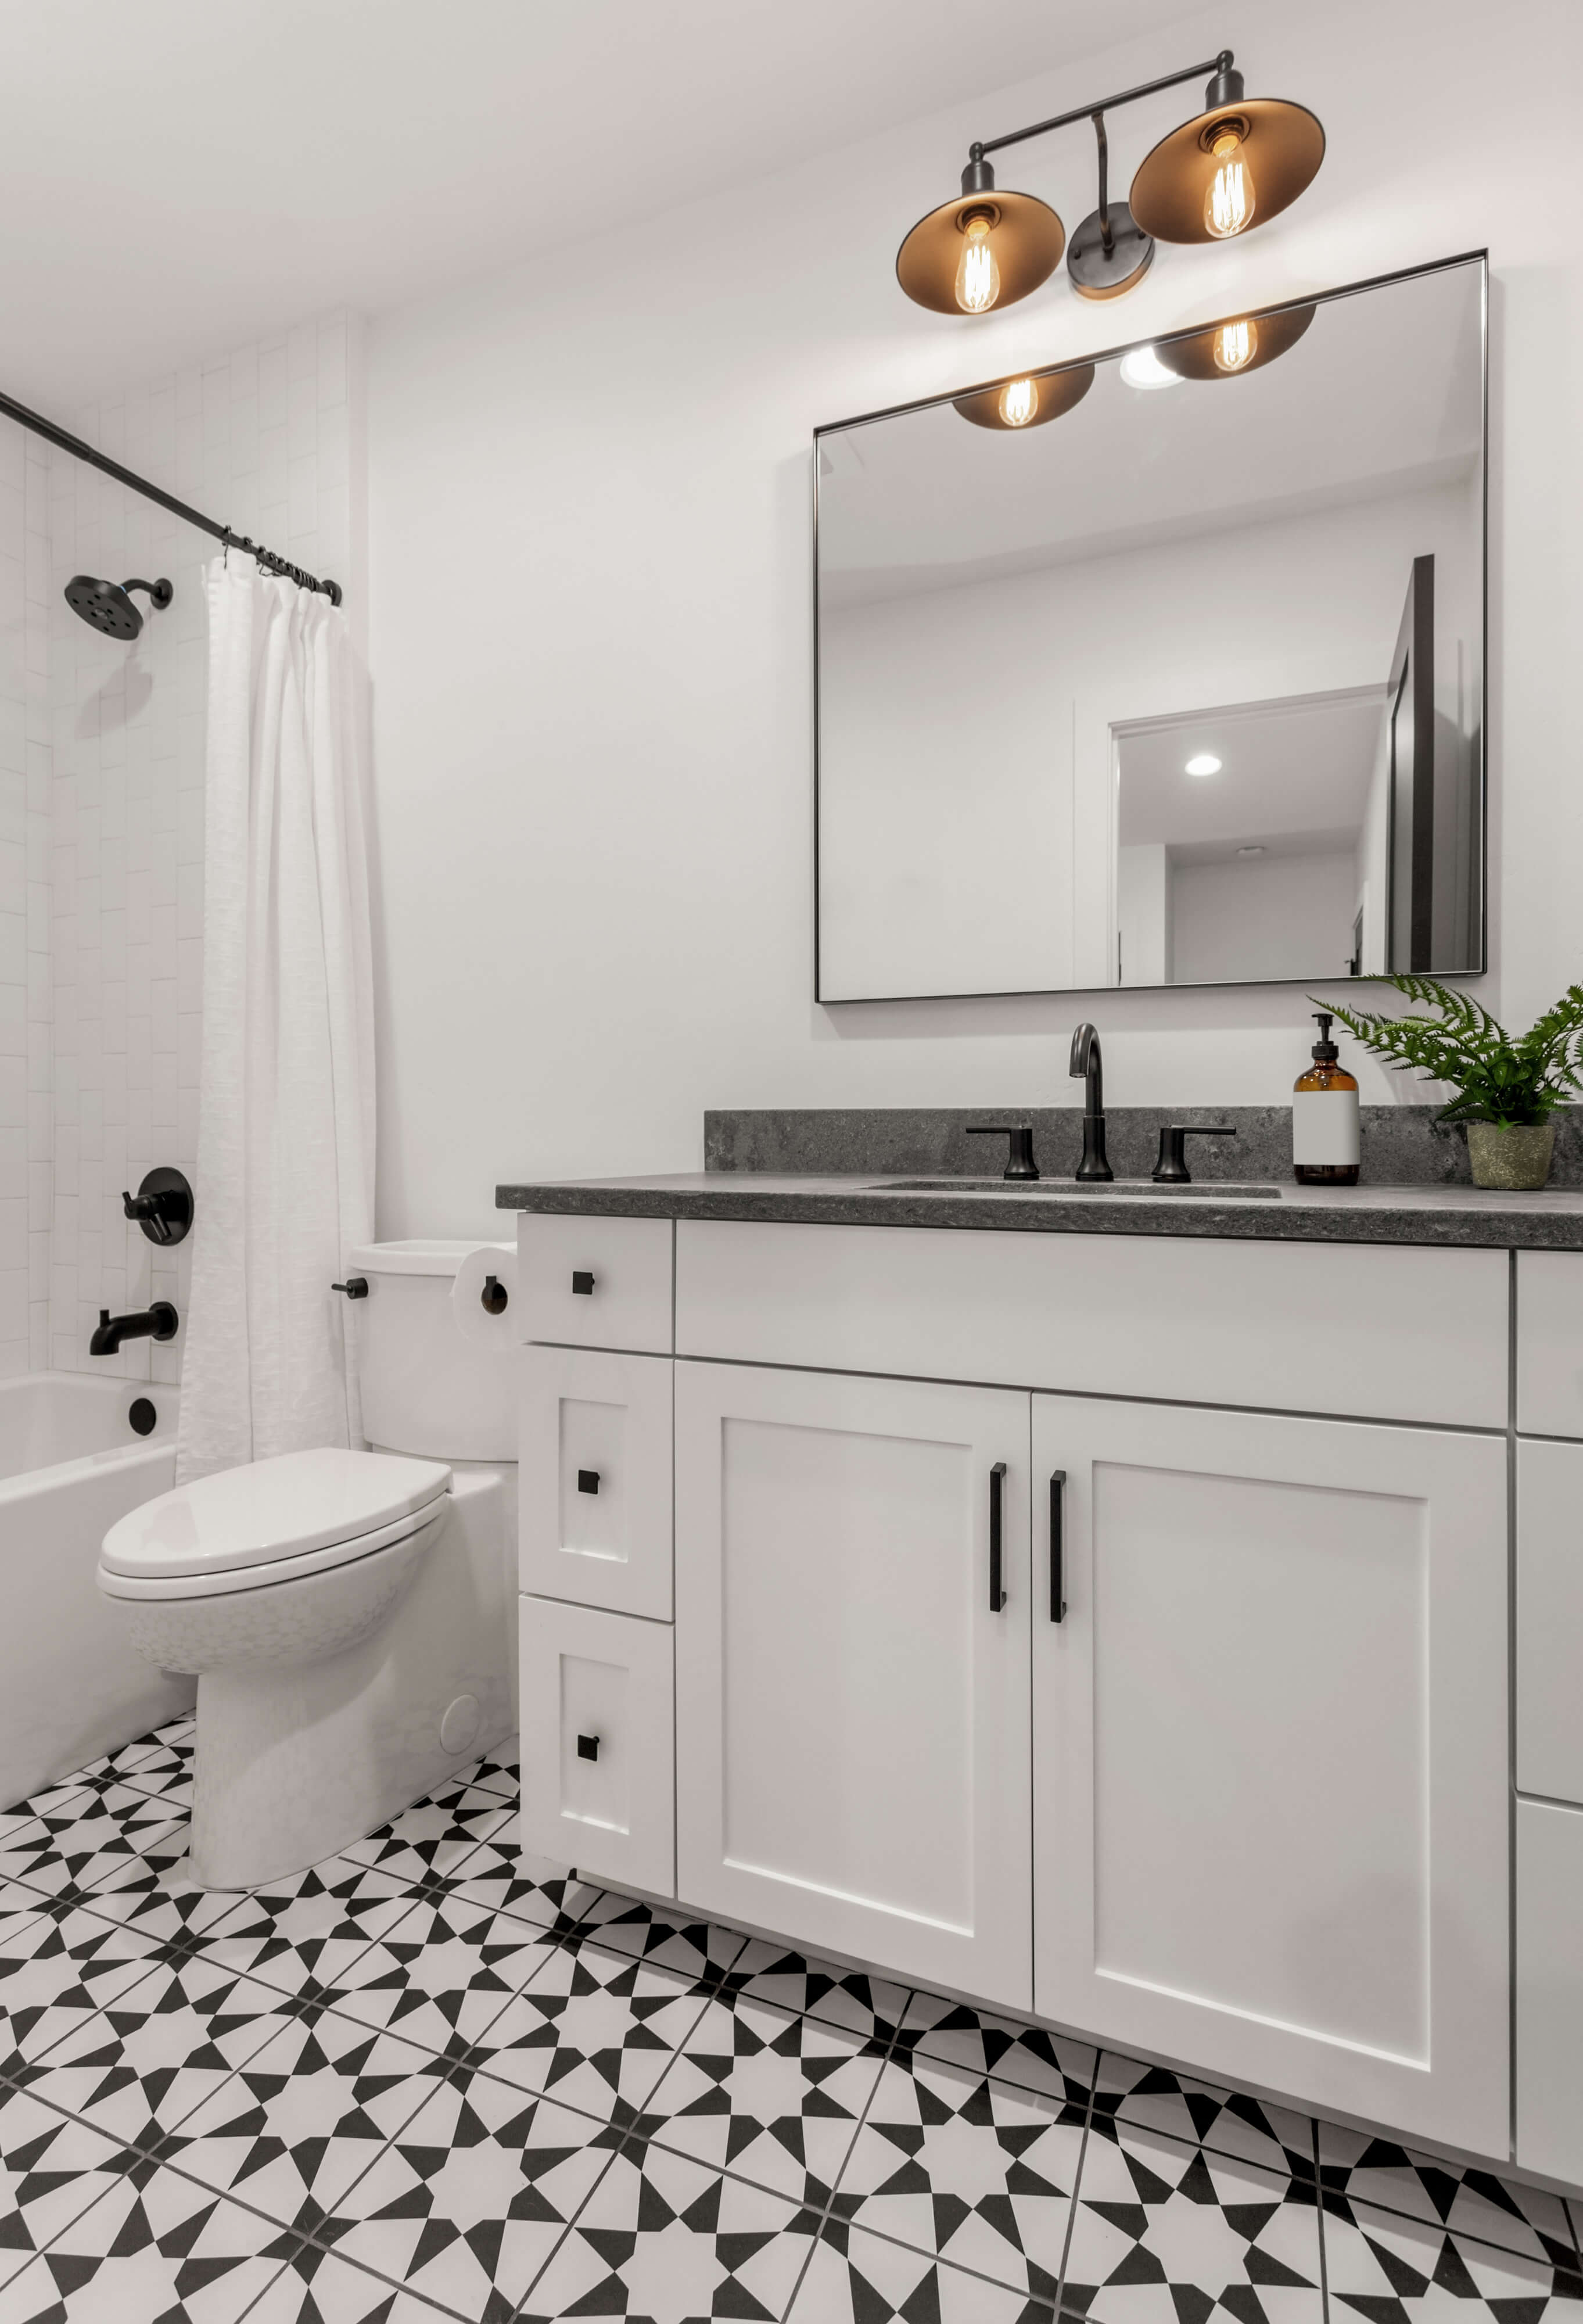
| Midrange Bathroom Remodel | $15,737 | $9,500 | 60.4% |
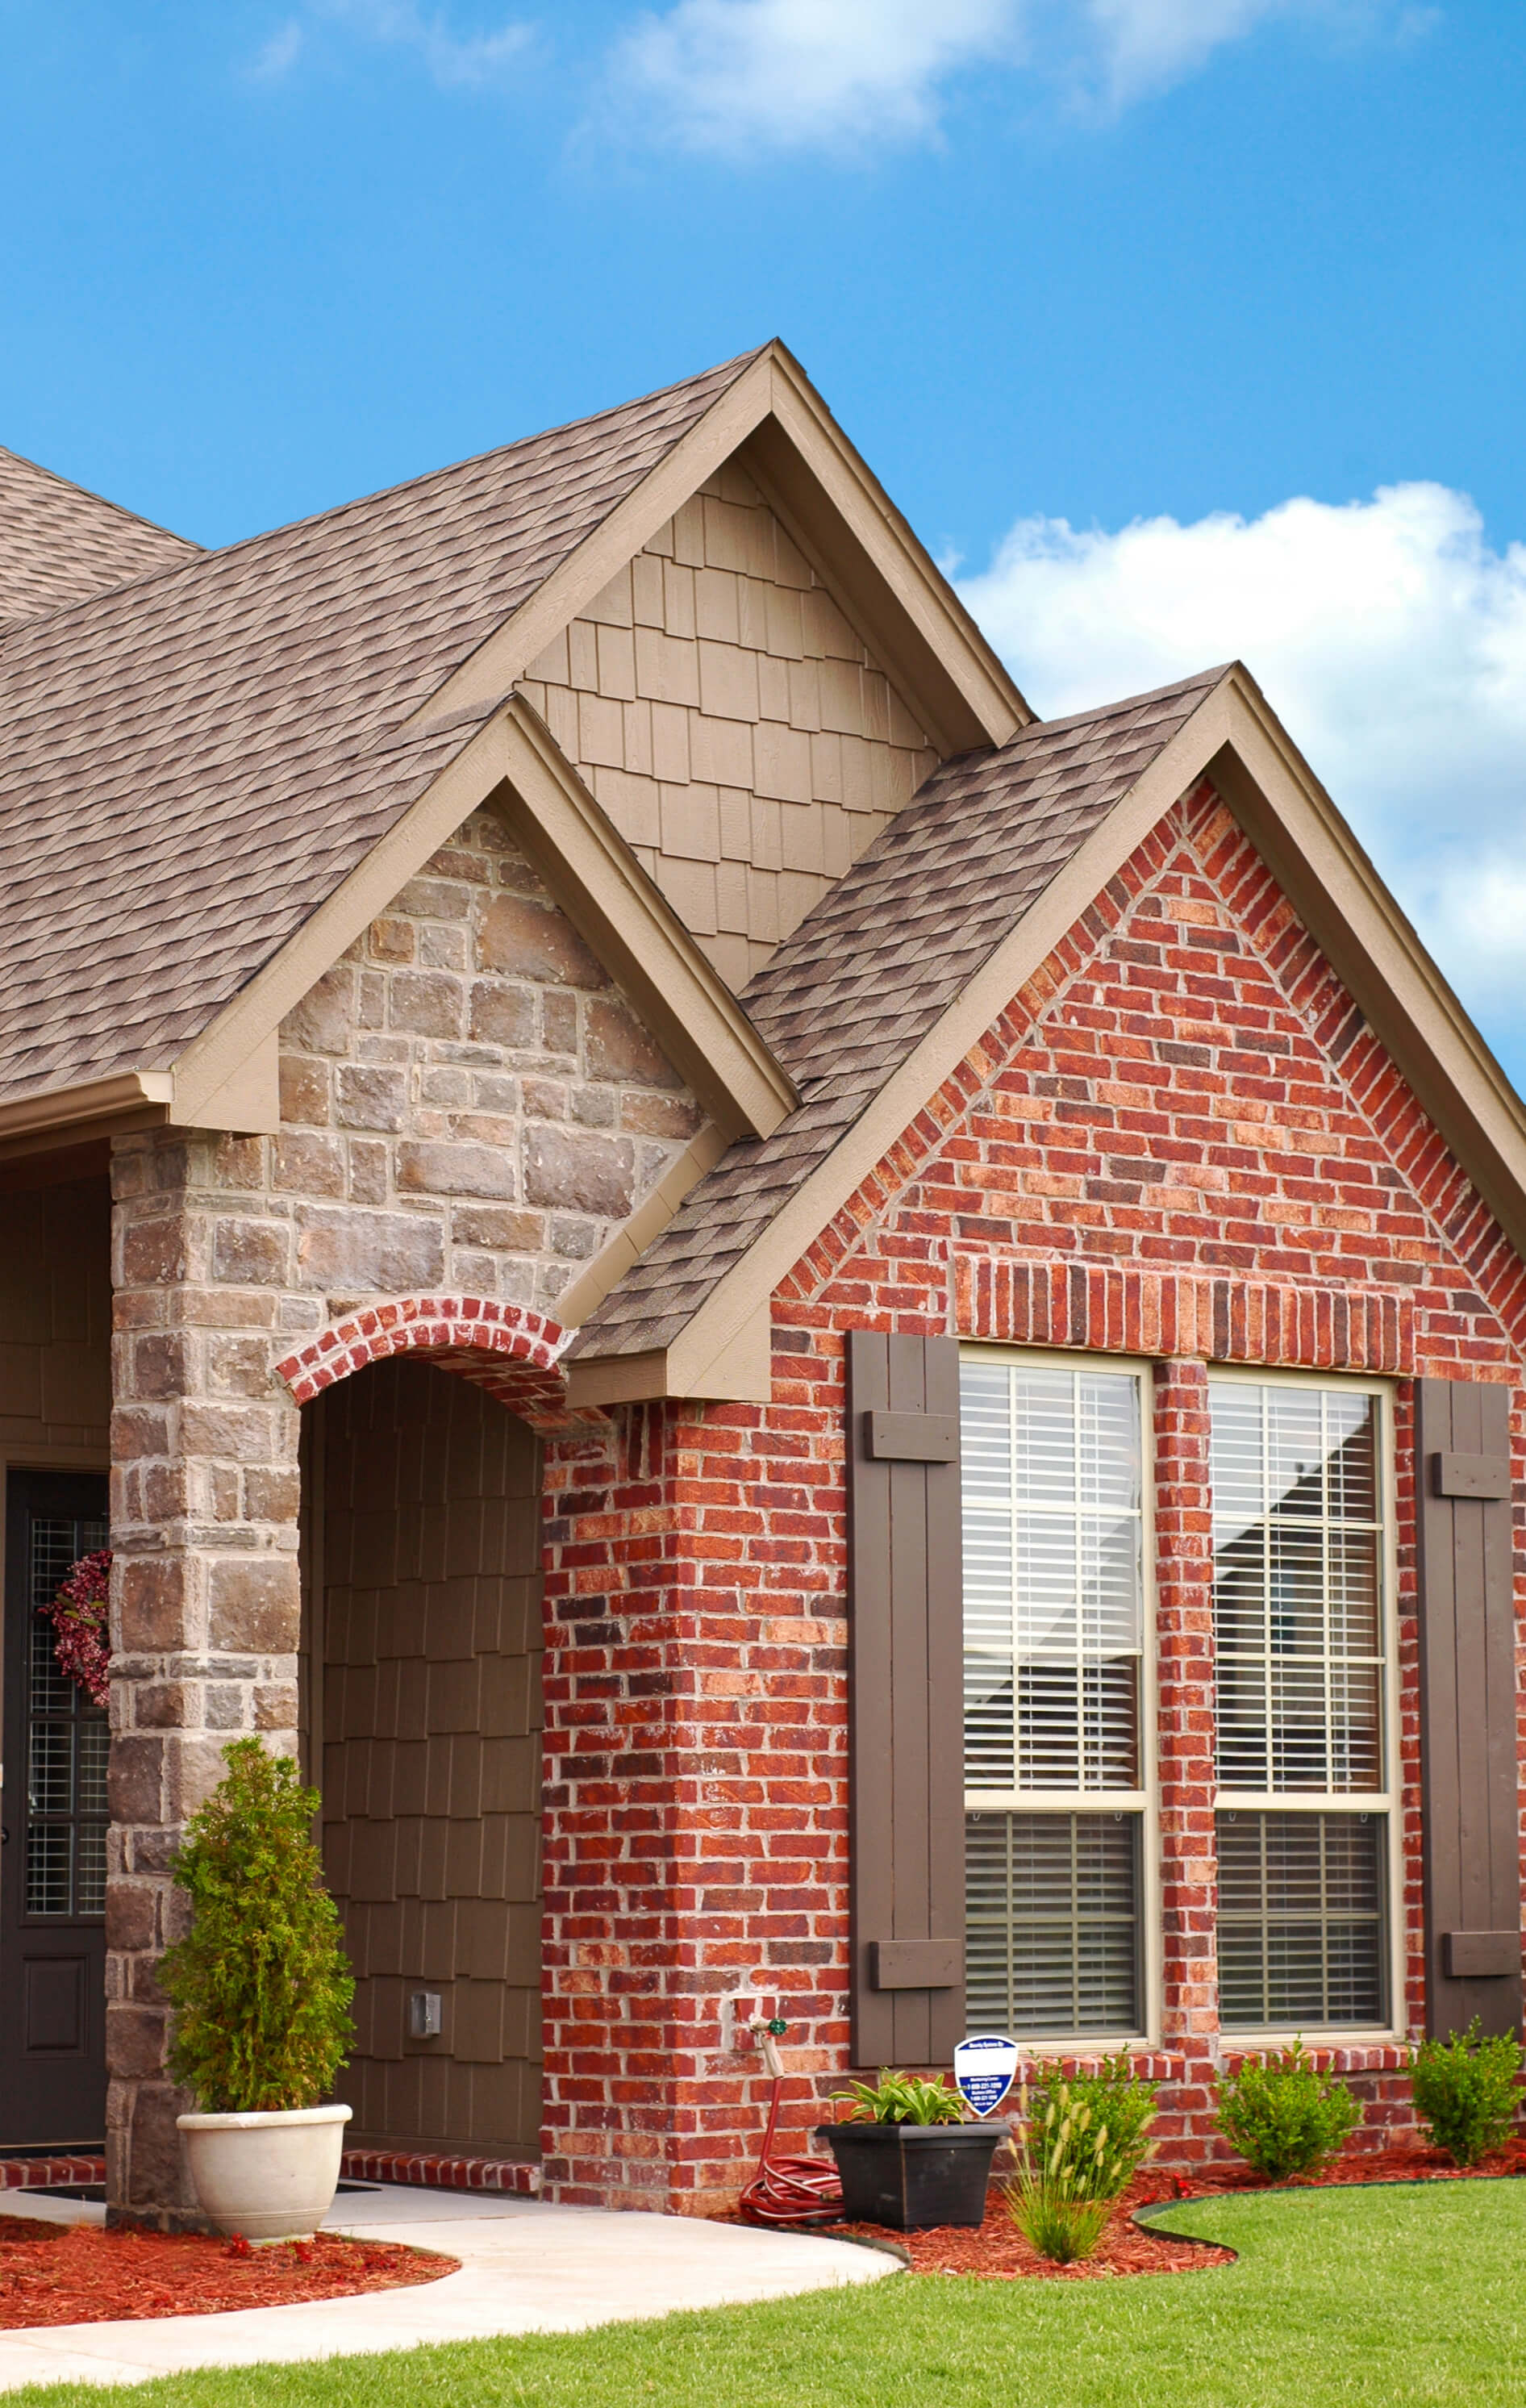
| Manufactured Stone Veneer | $16,210 | $9,687 | 59.8% |
| Bathroom Addition Midrange | $60,433 | $34,300 | 56.8% |
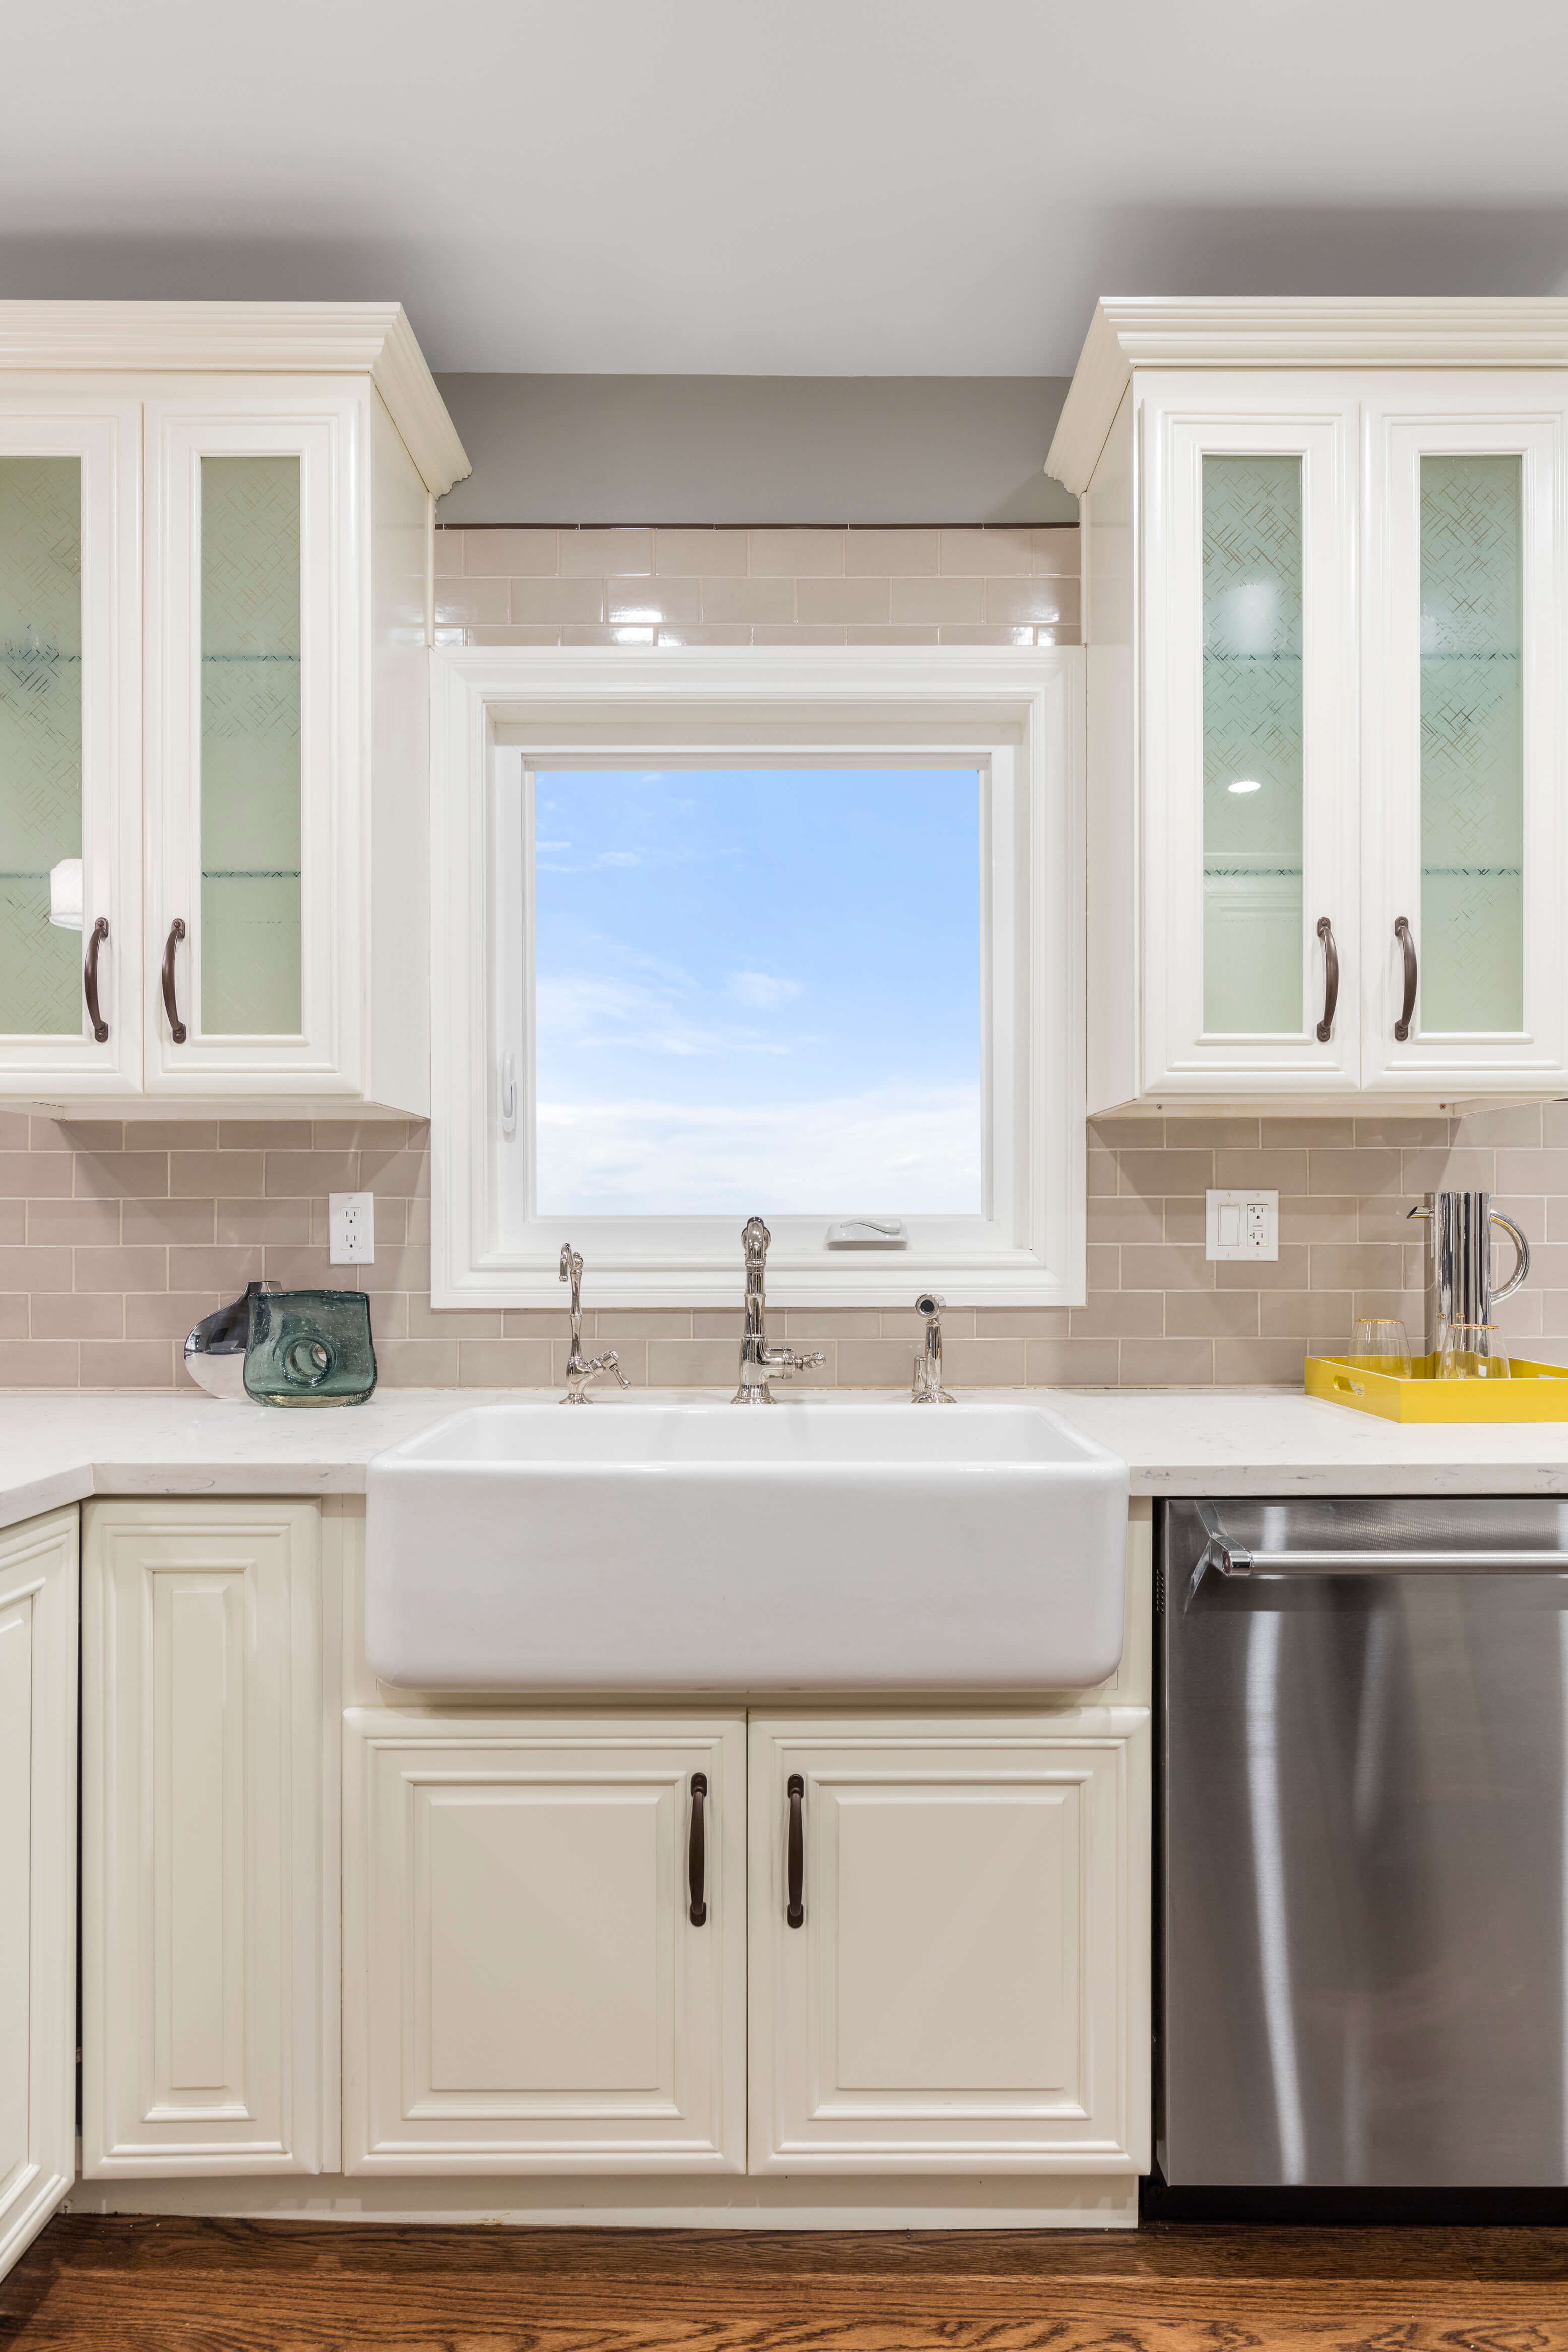
| Minor Kitchen Remodel | $20,262 | $11,500 | 56.8% |
| Laminate Flooring | $1,517 | $850 | 56.0% |
| Second Floor Garage Addition | $18,184 | $9,638 | 53.0% |
| Upscale Major Kitchen Remodel | $61,350 | $32,516 | 53.0% |
| Midrange Kitchen Remodel | $45,509 | $24,120 | 53.0% |
| Upscale Primary Suite Addition | $148,032 | $74,016 | 50.0% |
| Laminate Kitchen Countertops | $2,023 | $1,011 | 50.0% |
| Midrange Primary Suite Addition | $86,815 | $43,250 | 49.8% |
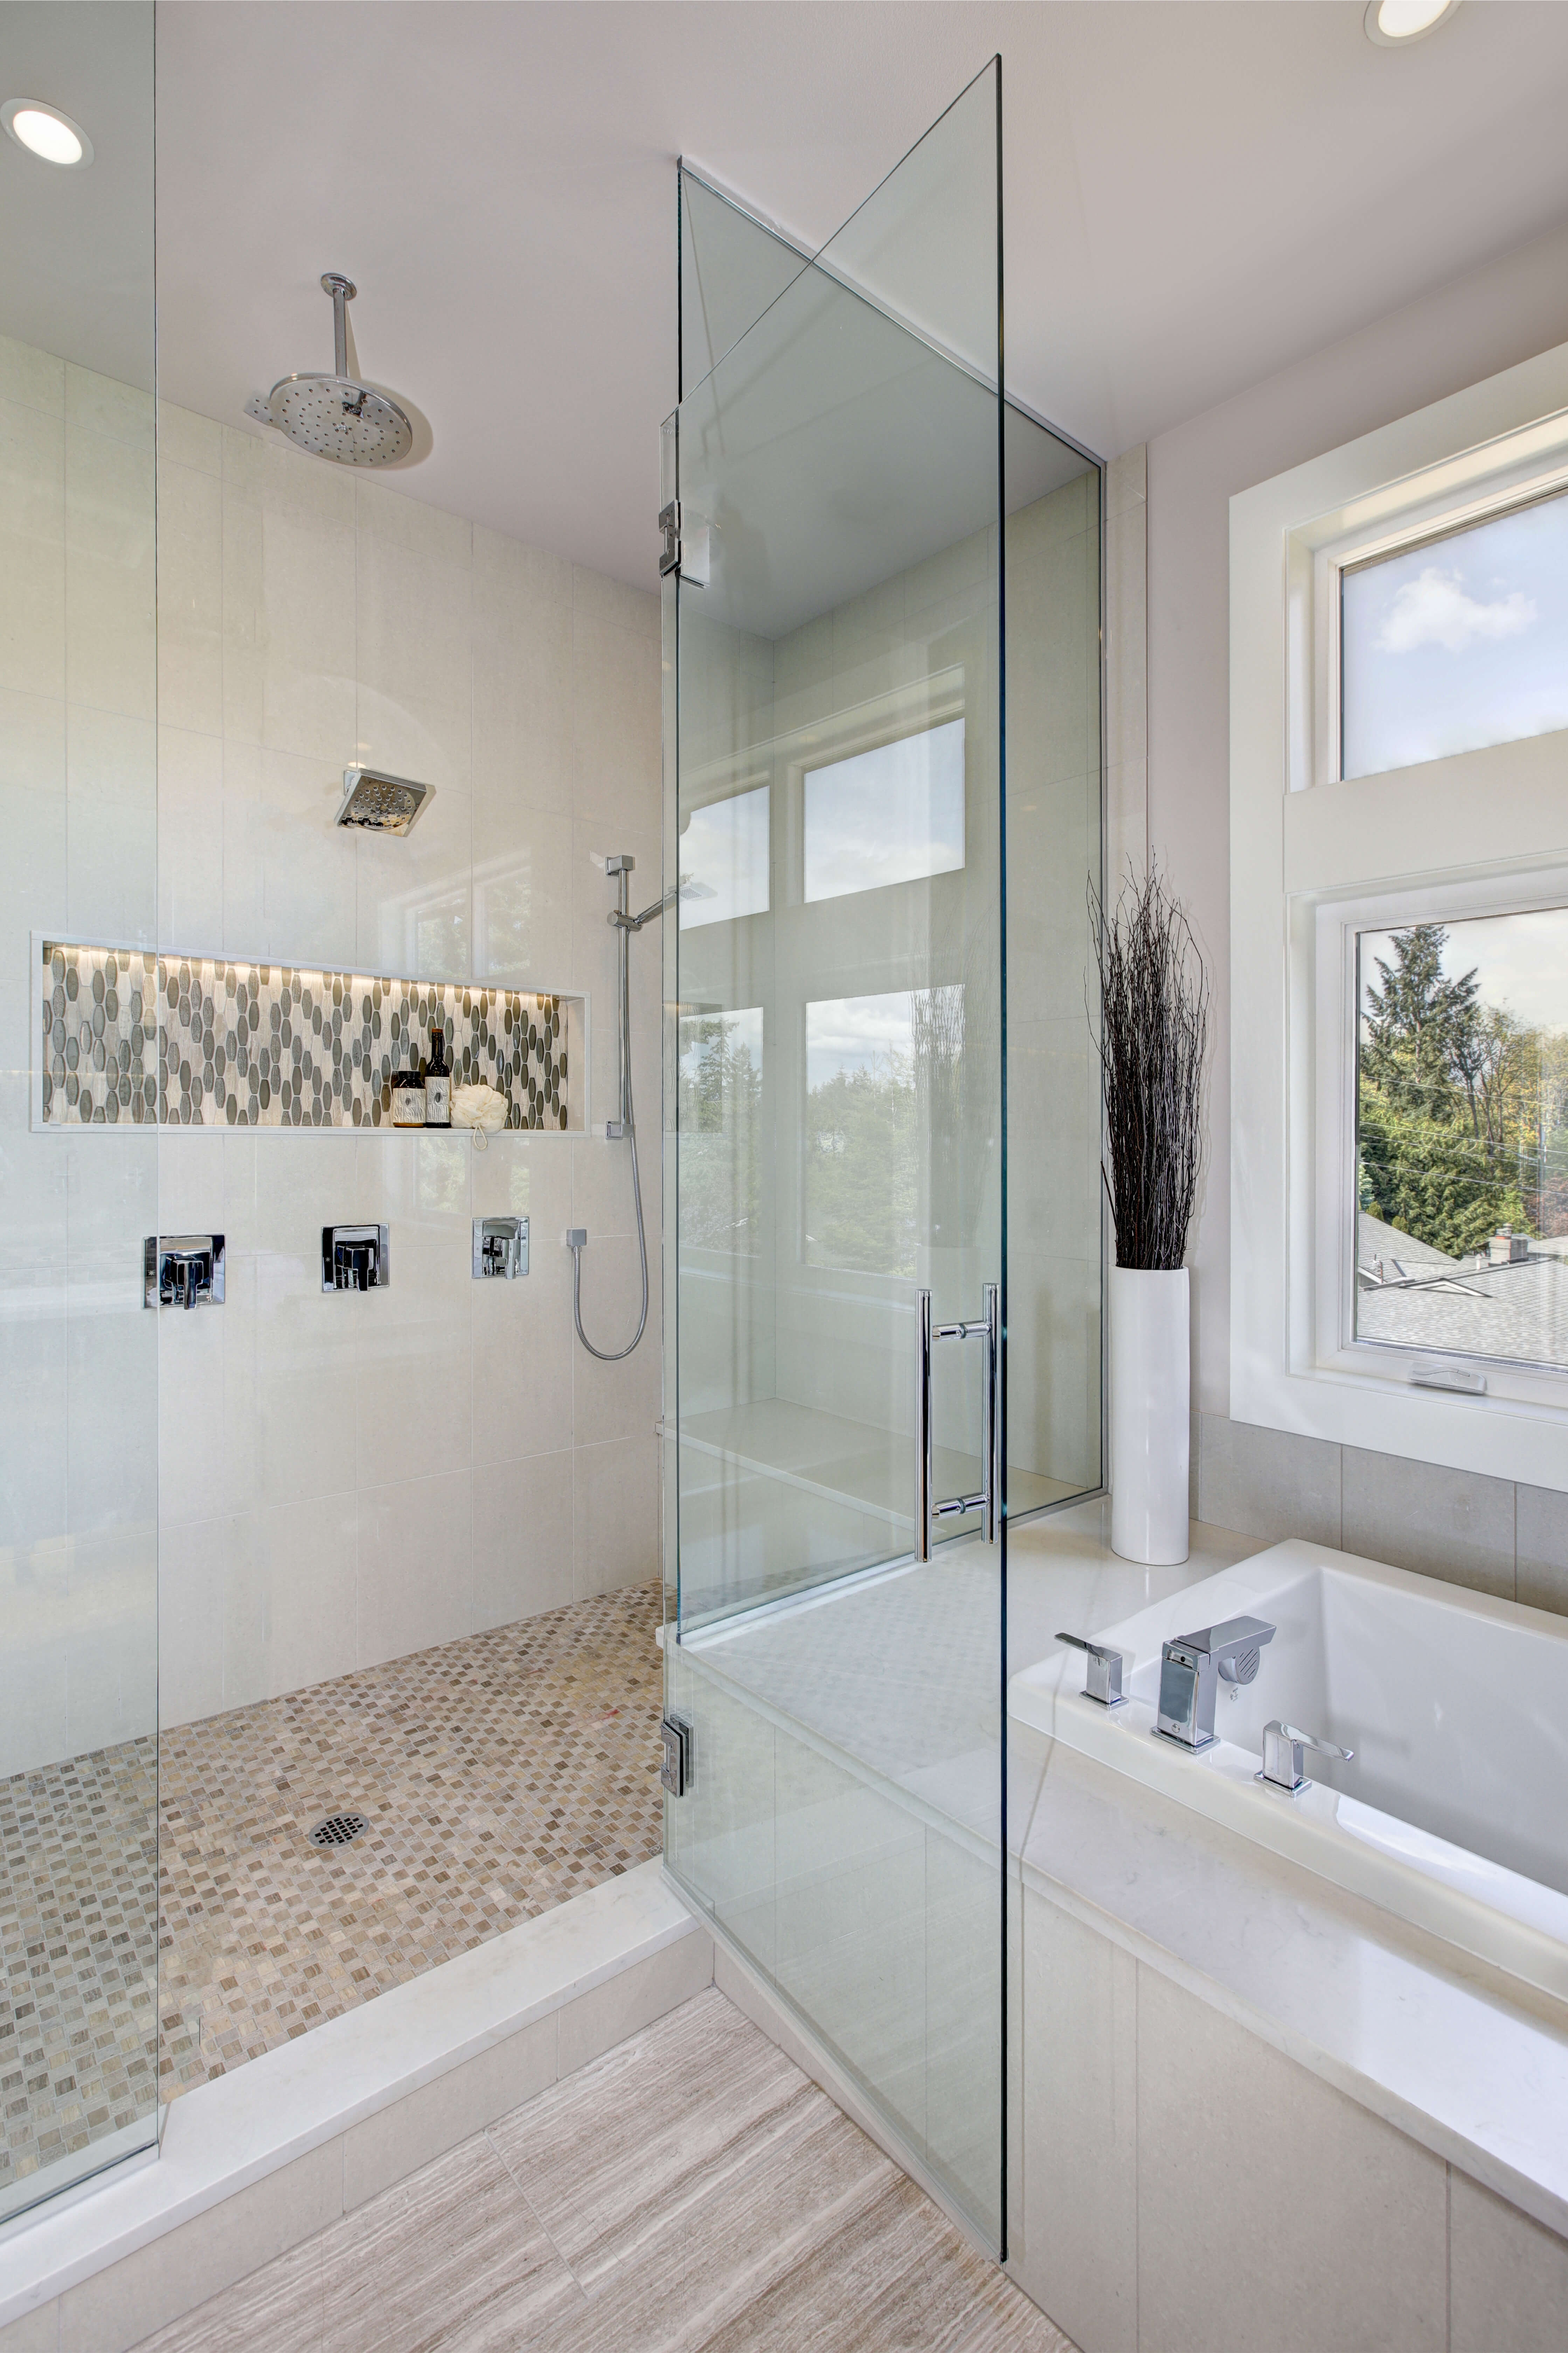
| Upscale Bathroom Remodel | $29,199 | $14,250 | 48.8% |
| Finished Basement | $49,819 | $11,300 | 22.7% |

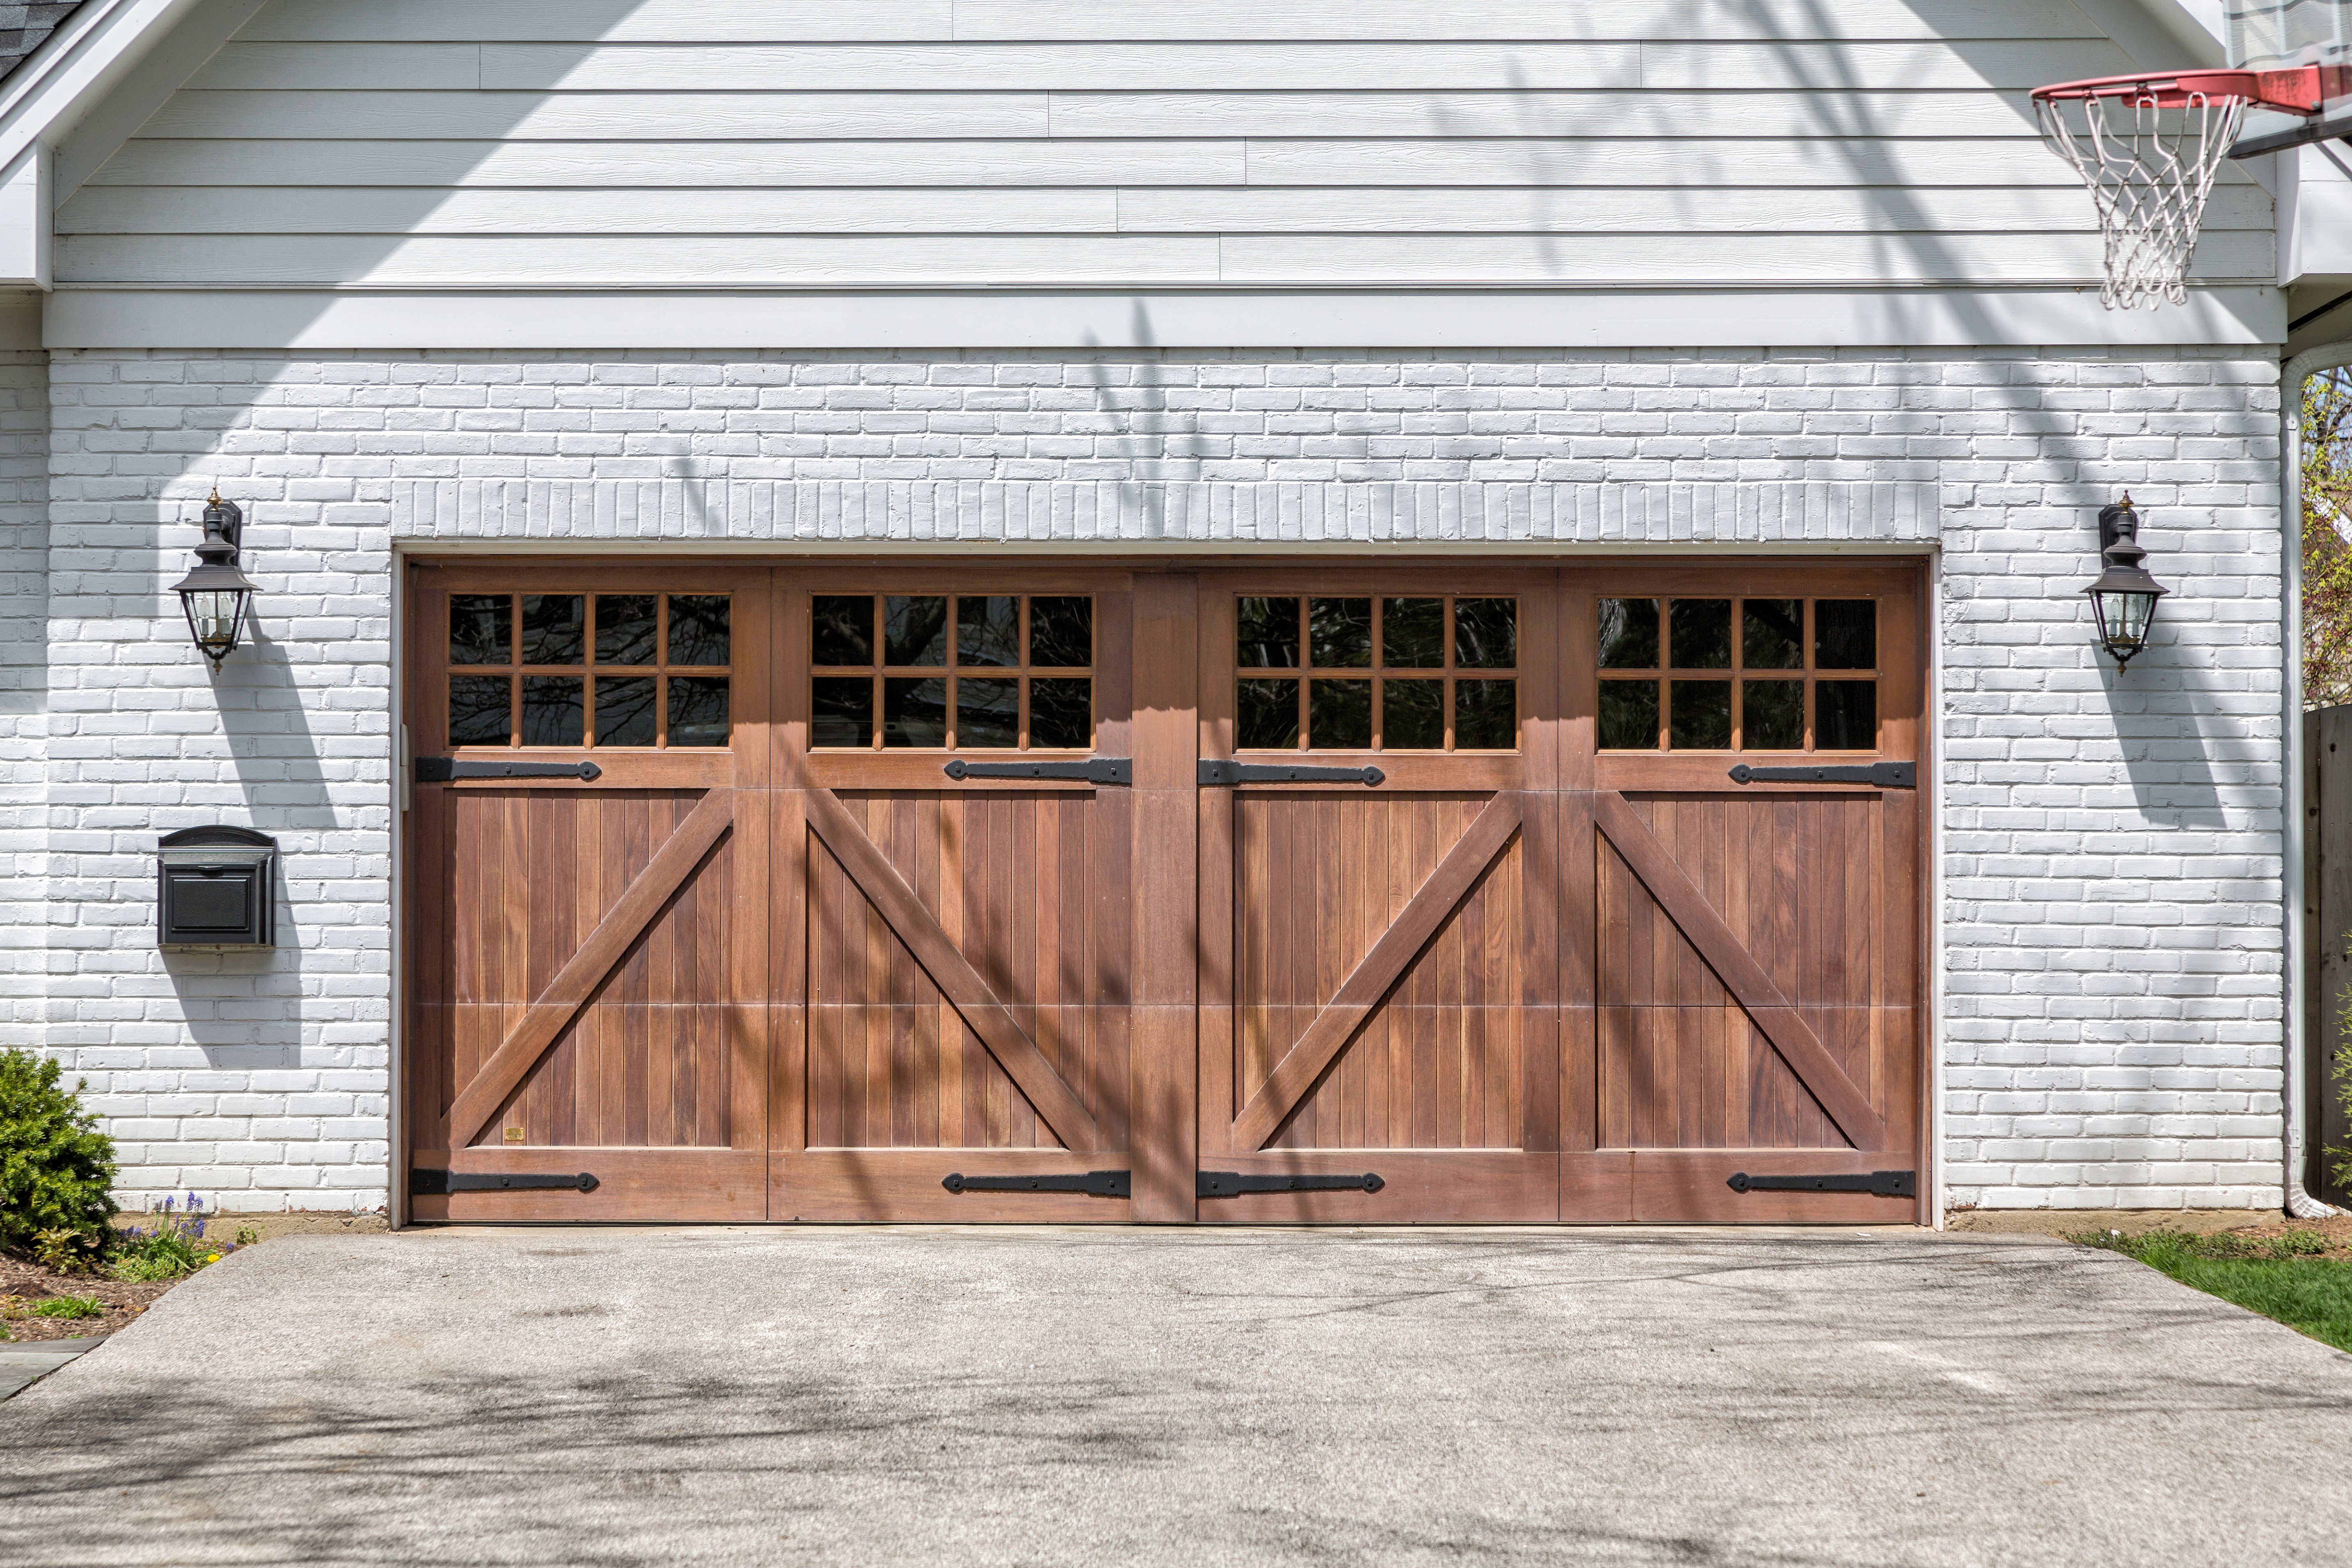
Replacing an existing garage door with a higher-quality, two-car insulated garage door with windows. This inexpensive project has the highest return on investment (ROI) of the 34 home renovations we reviewed.
$0
$0
0%
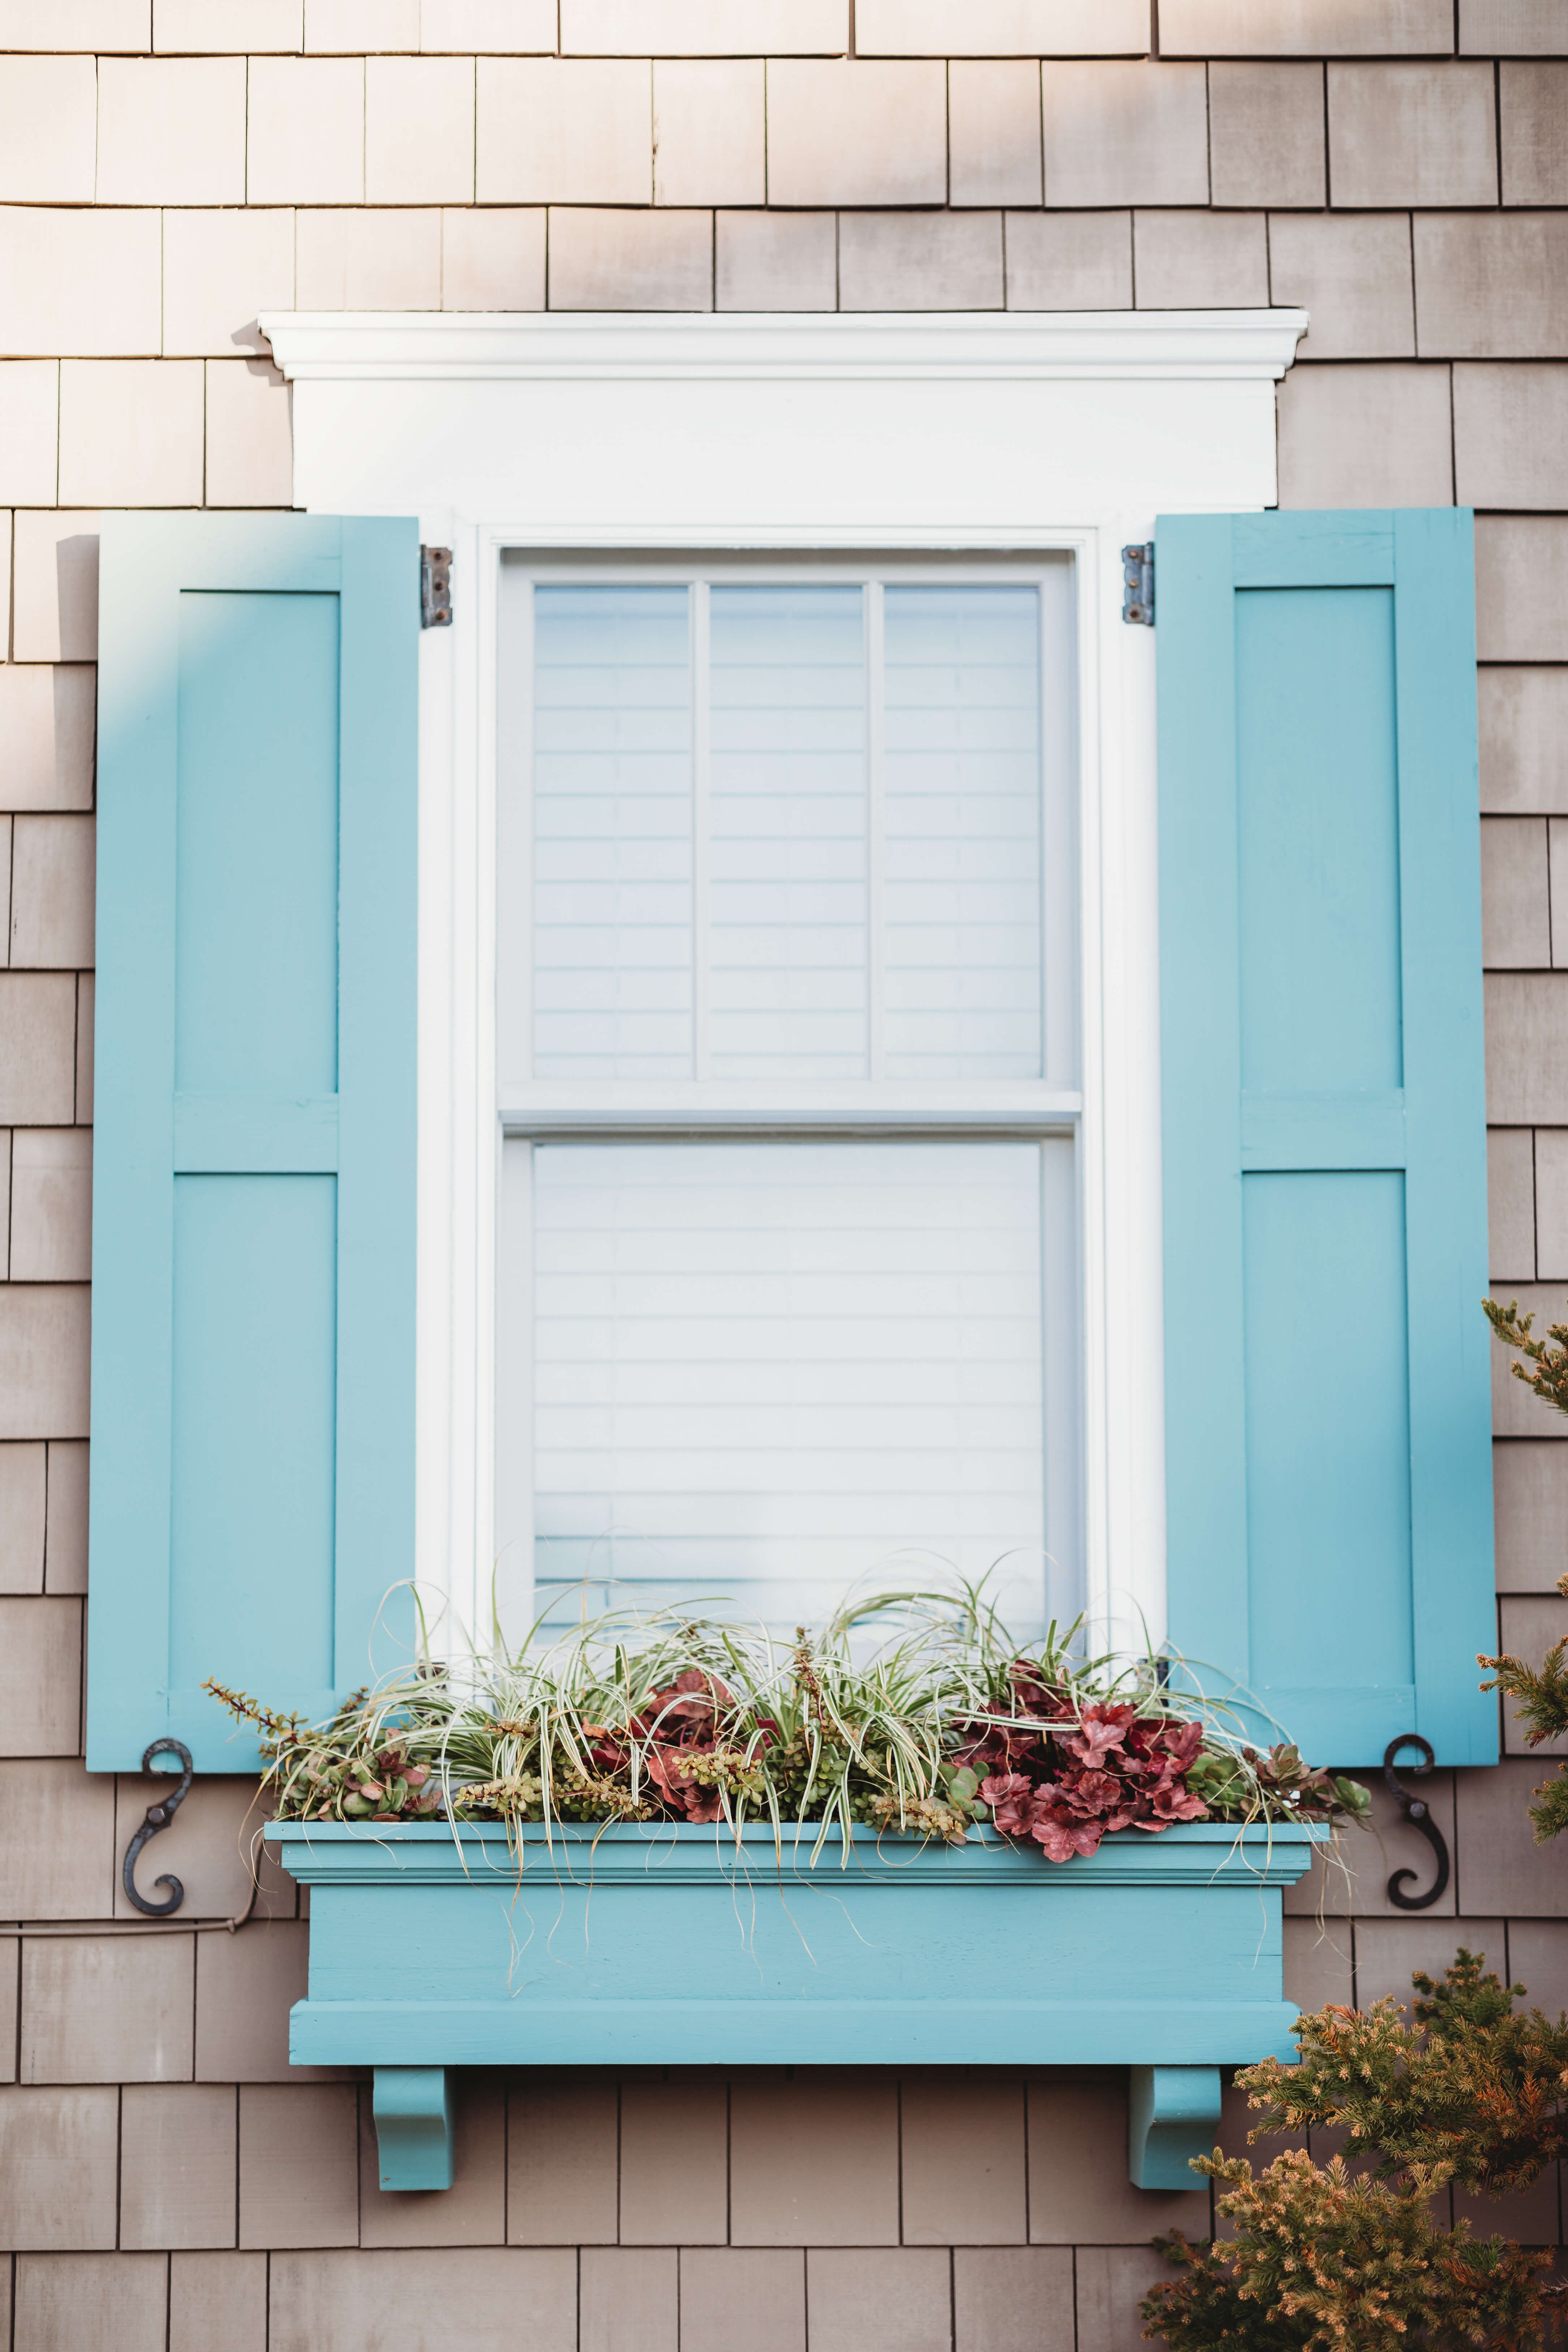
Replacing 10 existing 3x5-foot windows with double-hung, well-insulated wood windows.
$0
$0
0%
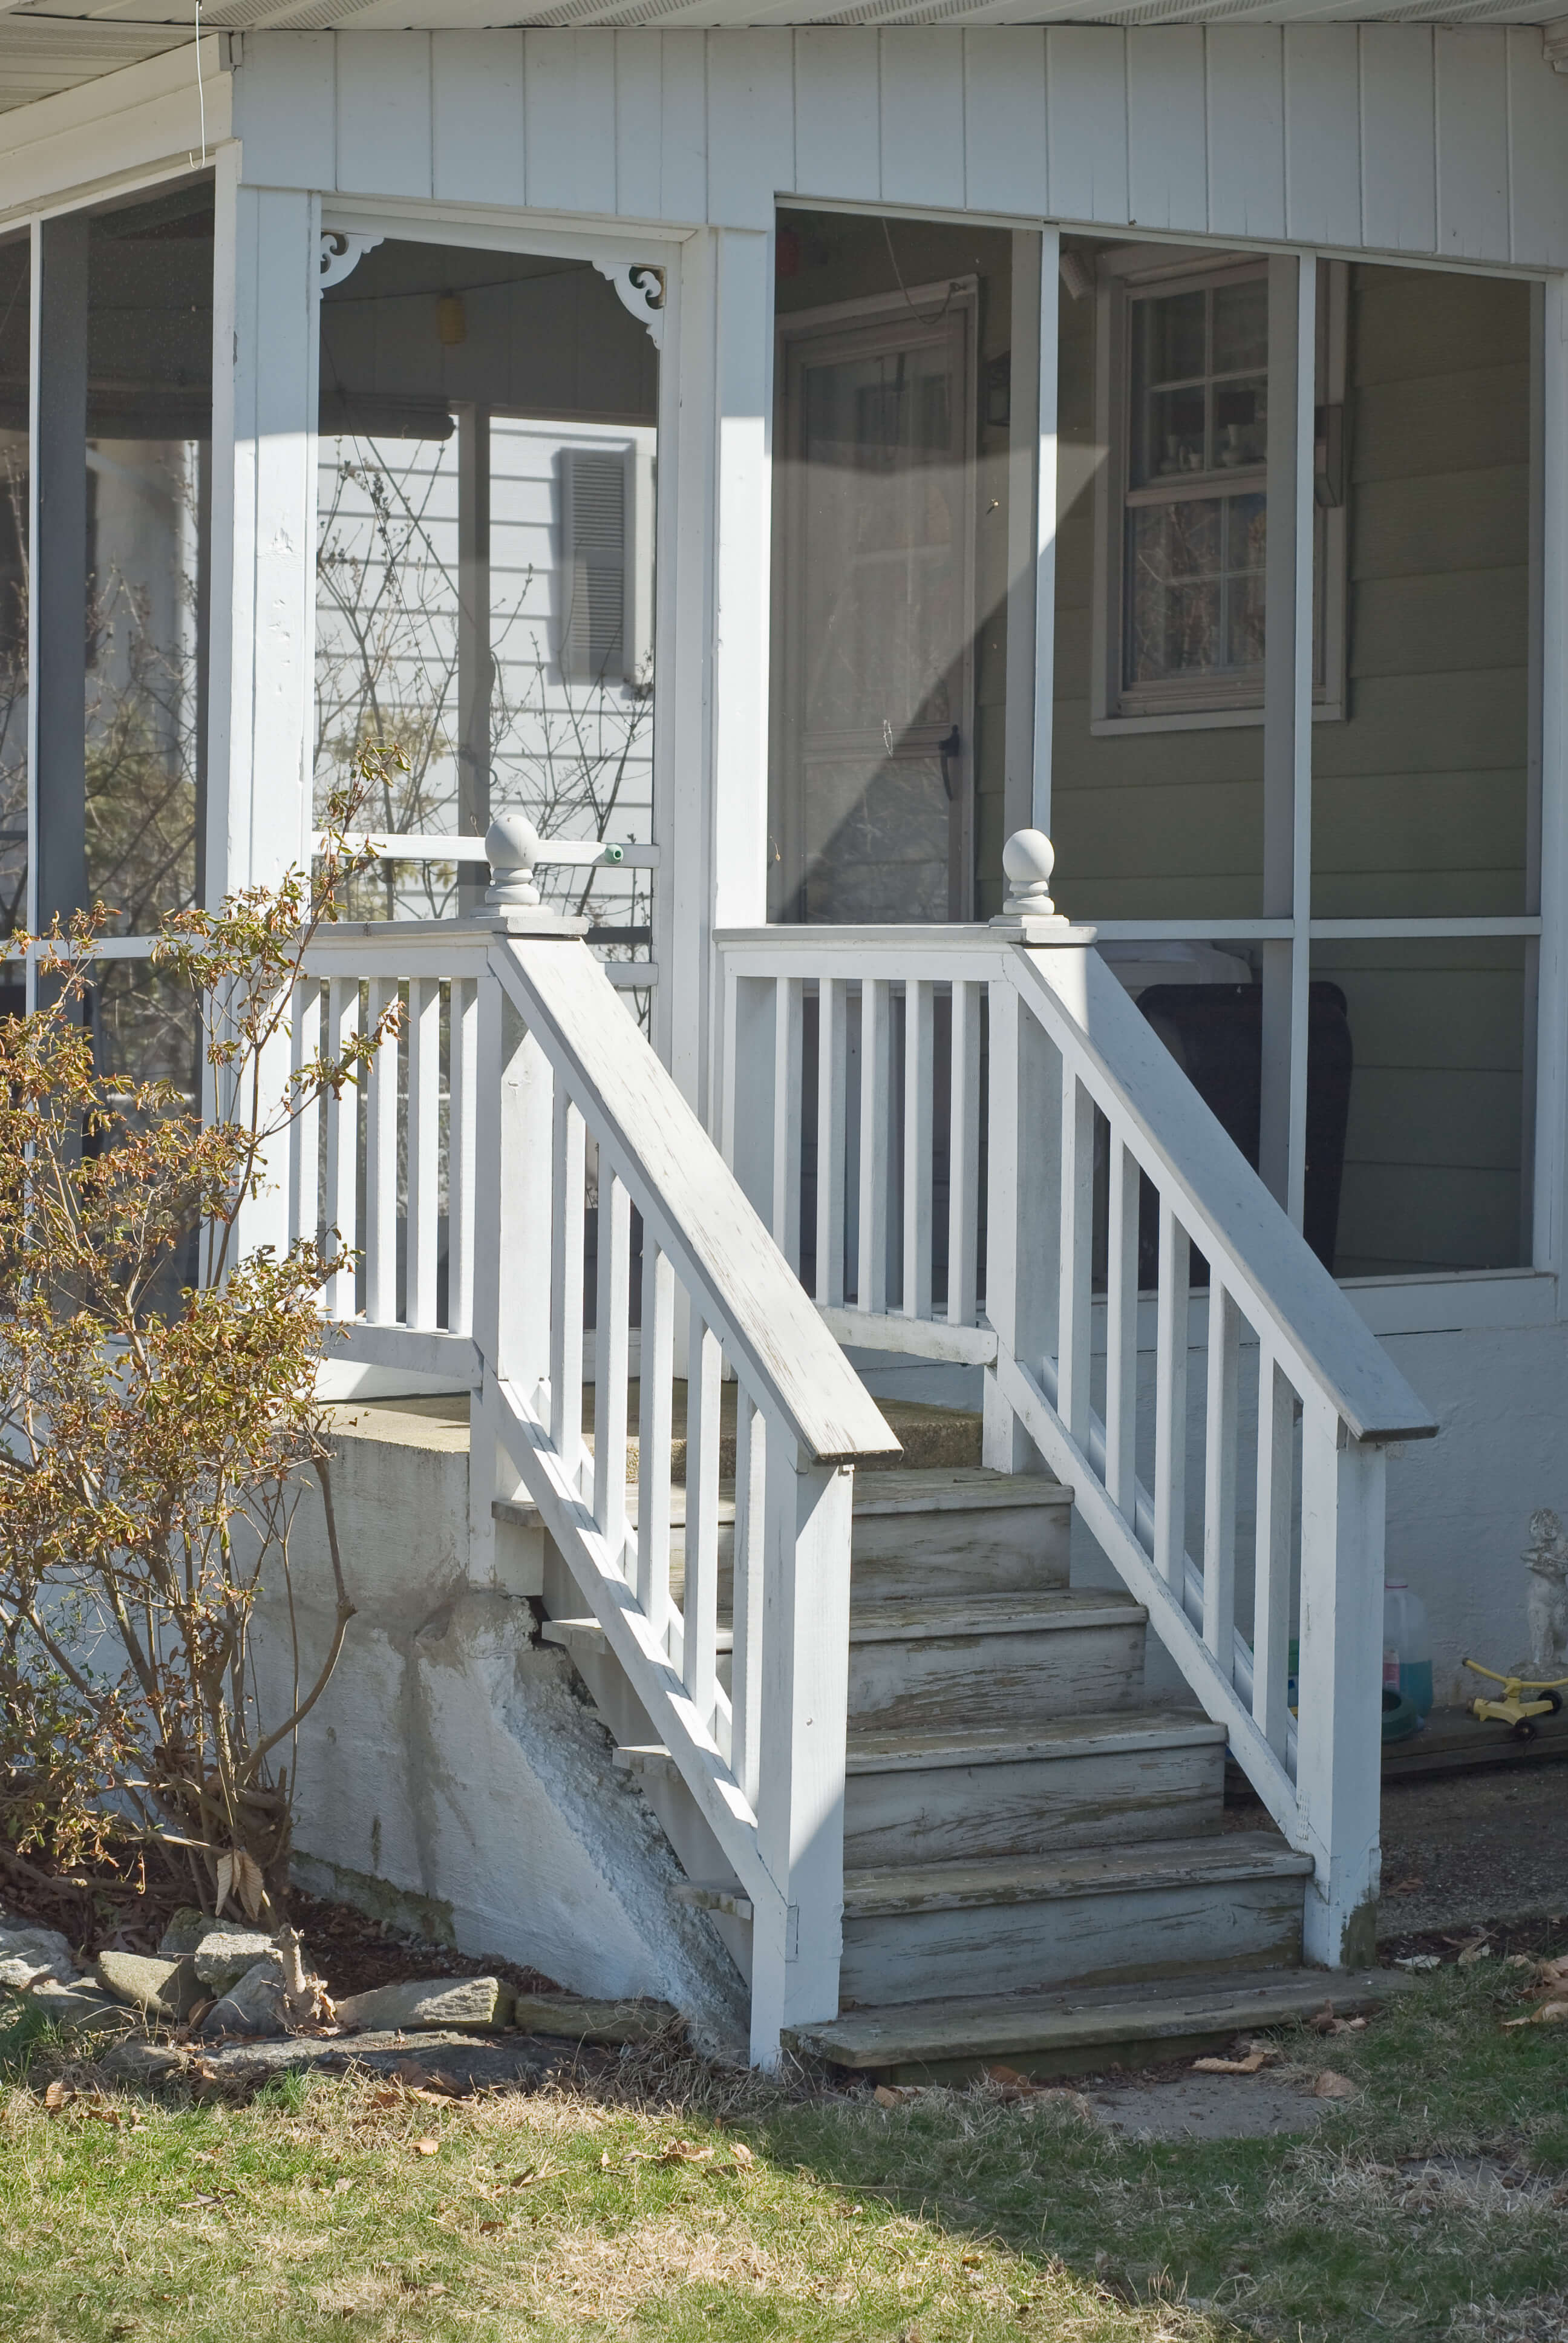
Adding a 16x20x14-foot screened-in porch to an existing deck or patio area.
$0
$0
0%
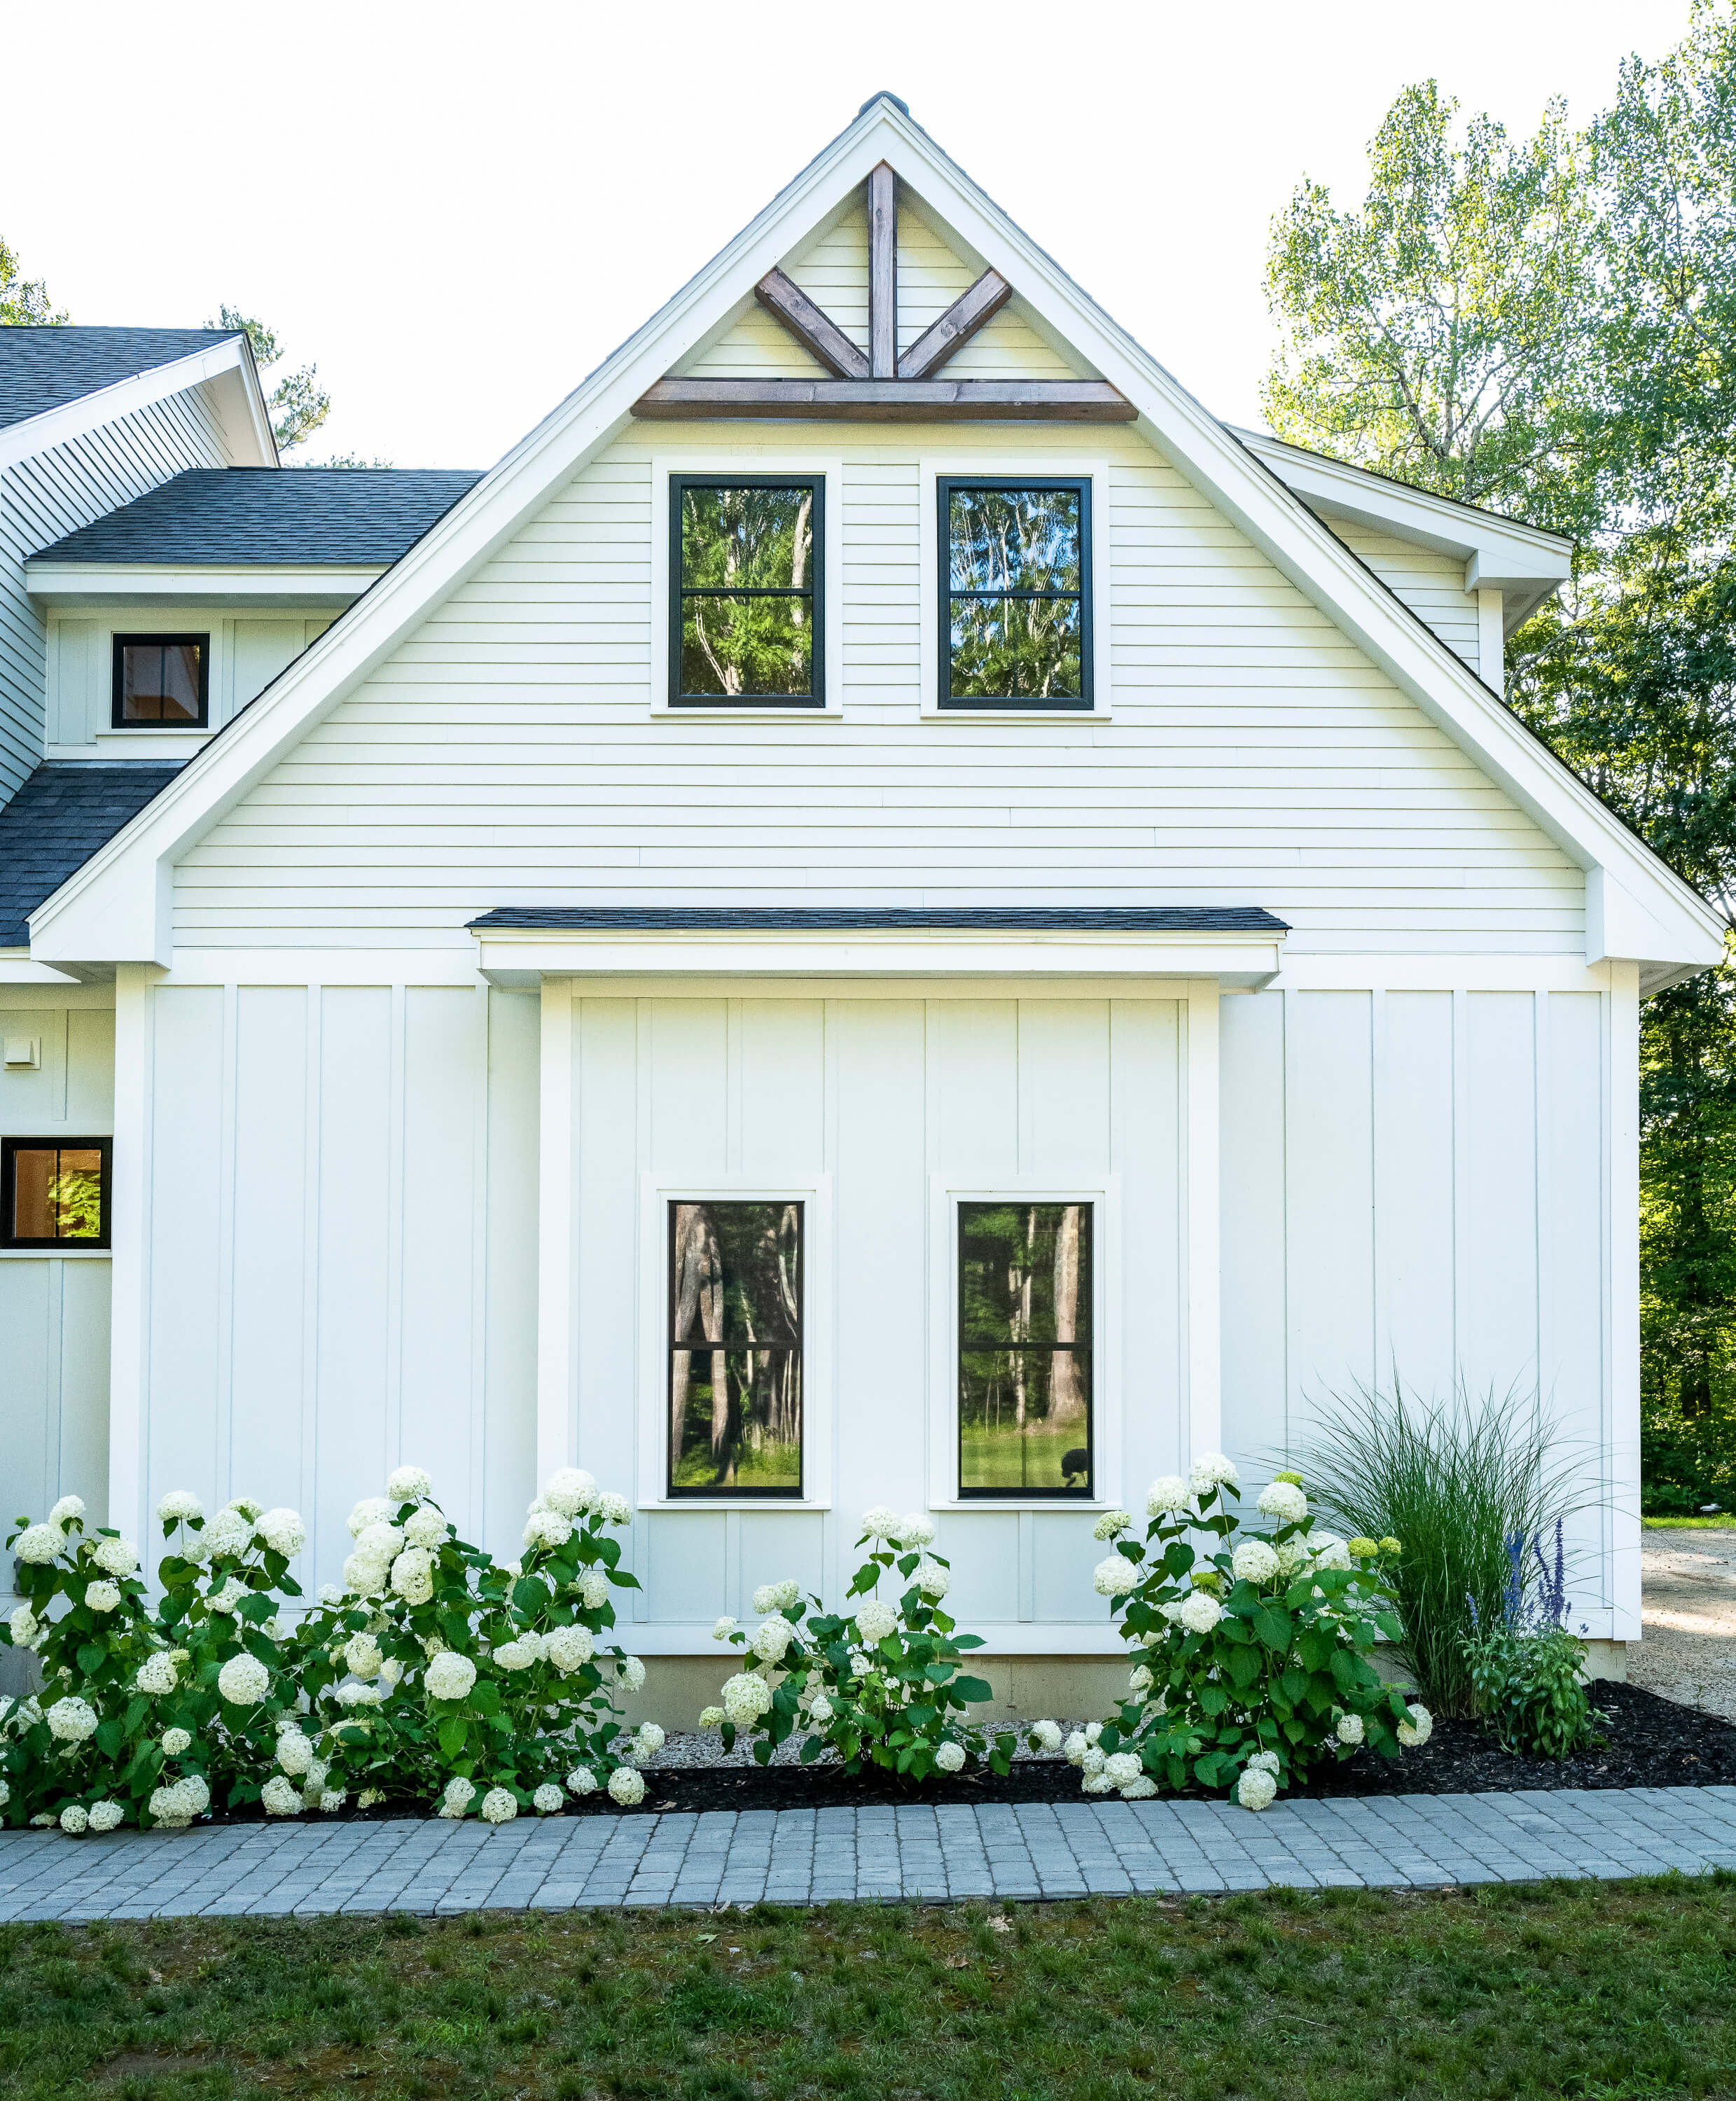
Removing and replacing existing siding on your home with fiber-cement siding.
$0
$0
0%
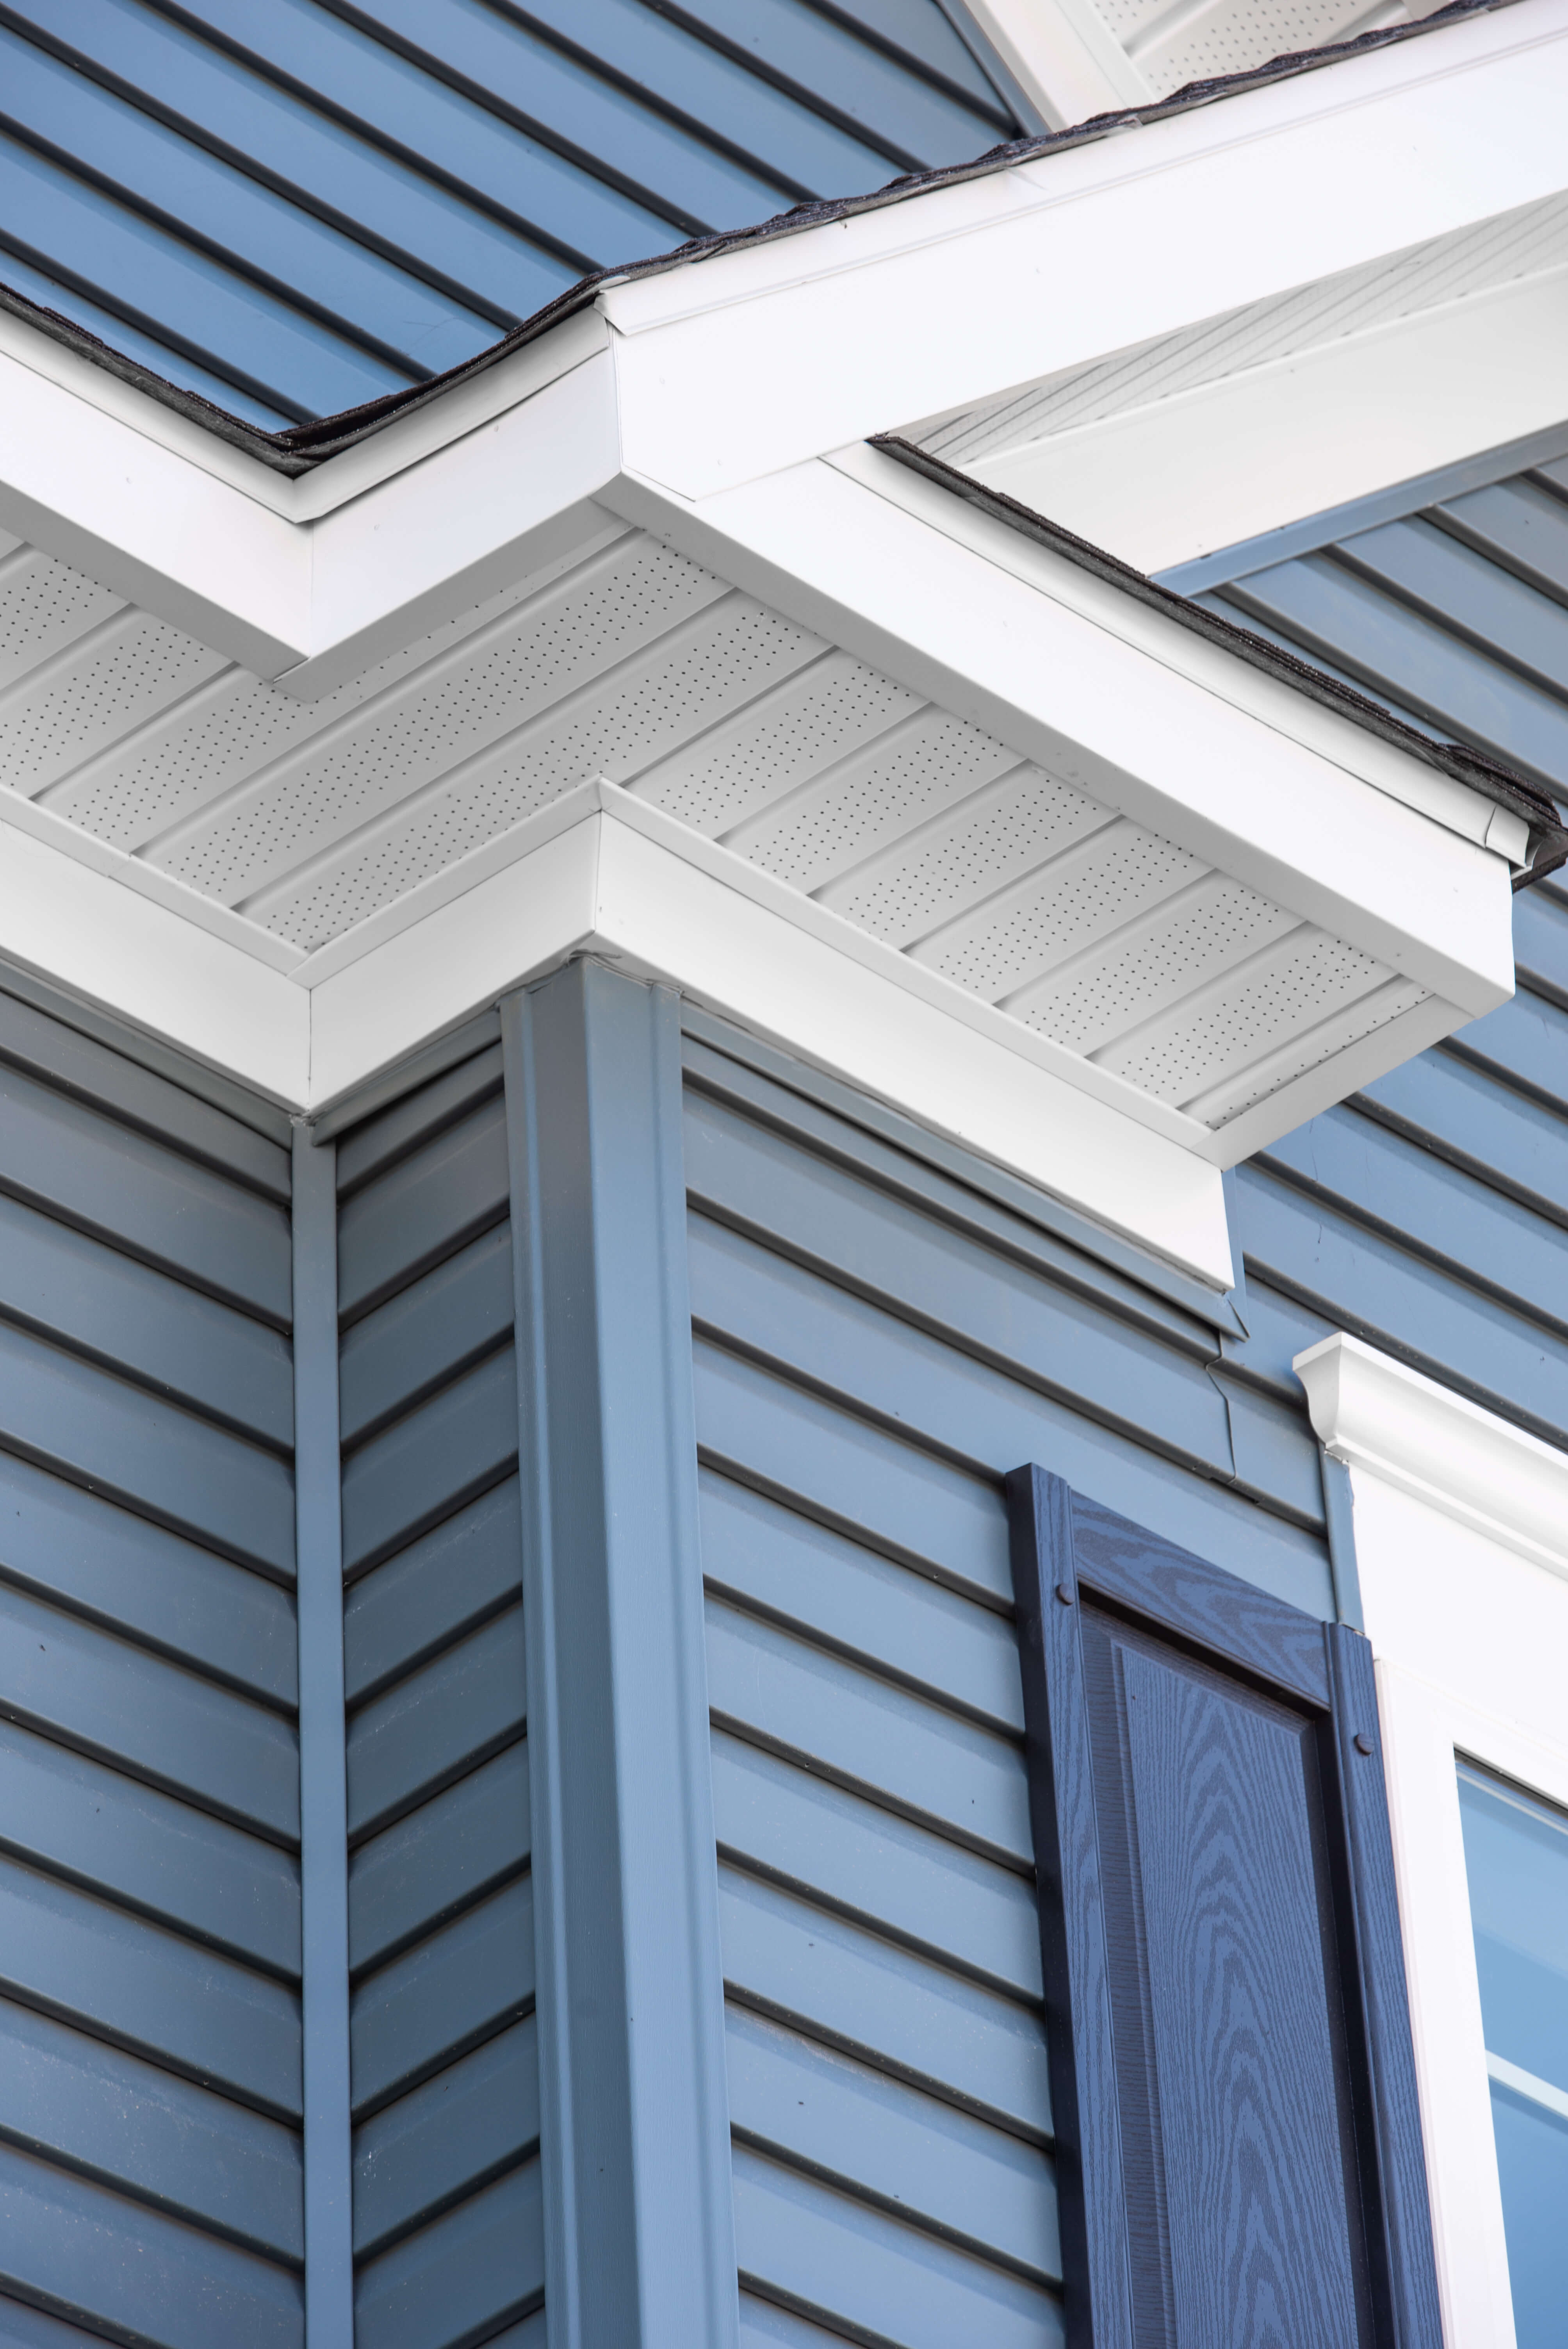
Removing and replacing existing siding on your home with vinyl siding.
$0
$0
0%
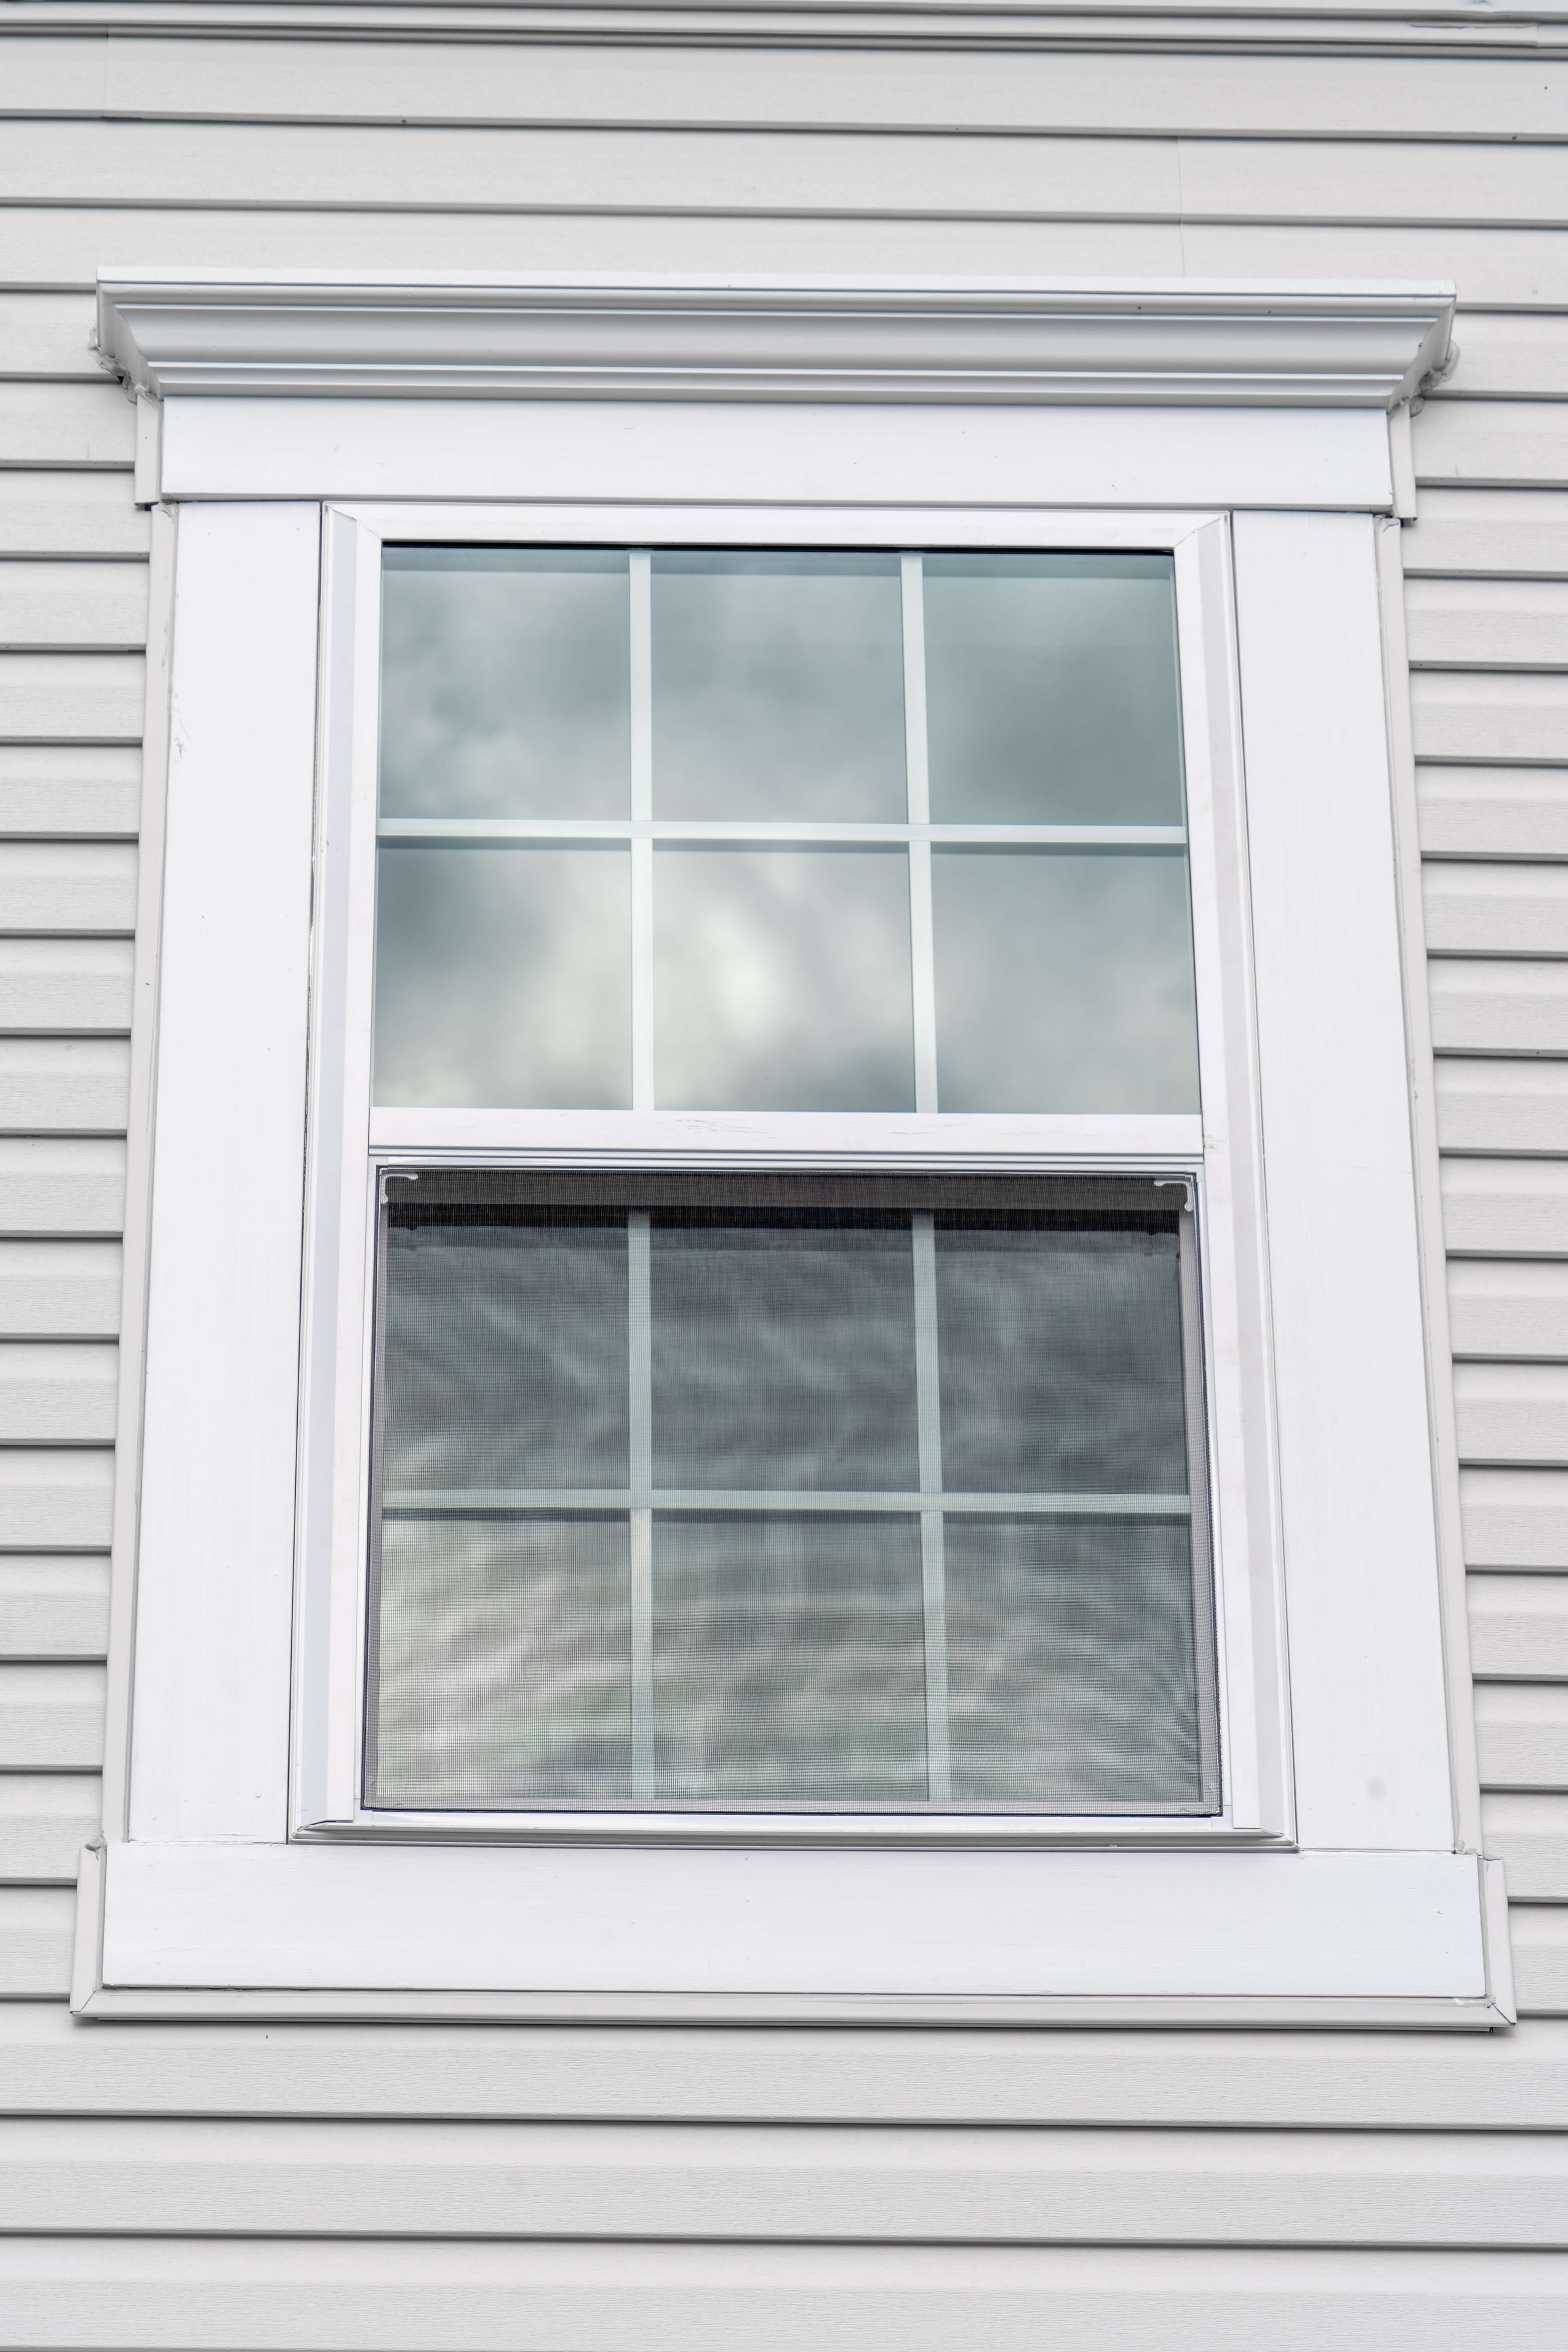
Replacing 10 existing windows with new vinyl windows.
$0
$0
0%
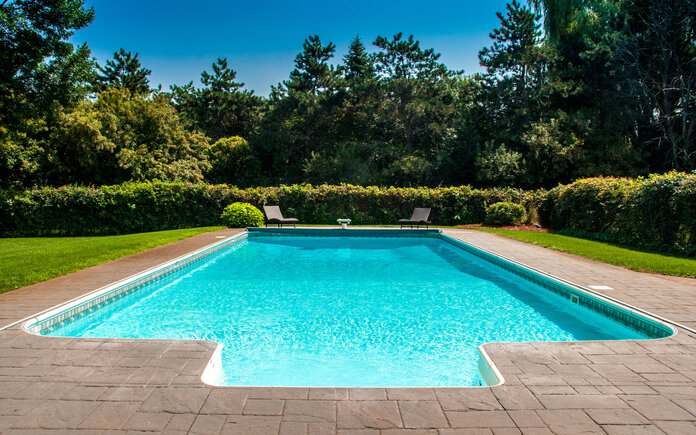
Digging a 14x28x5-foot, 19,000-gallon concrete pool with 336 square feet of concrete surround.
$0
$0
0%
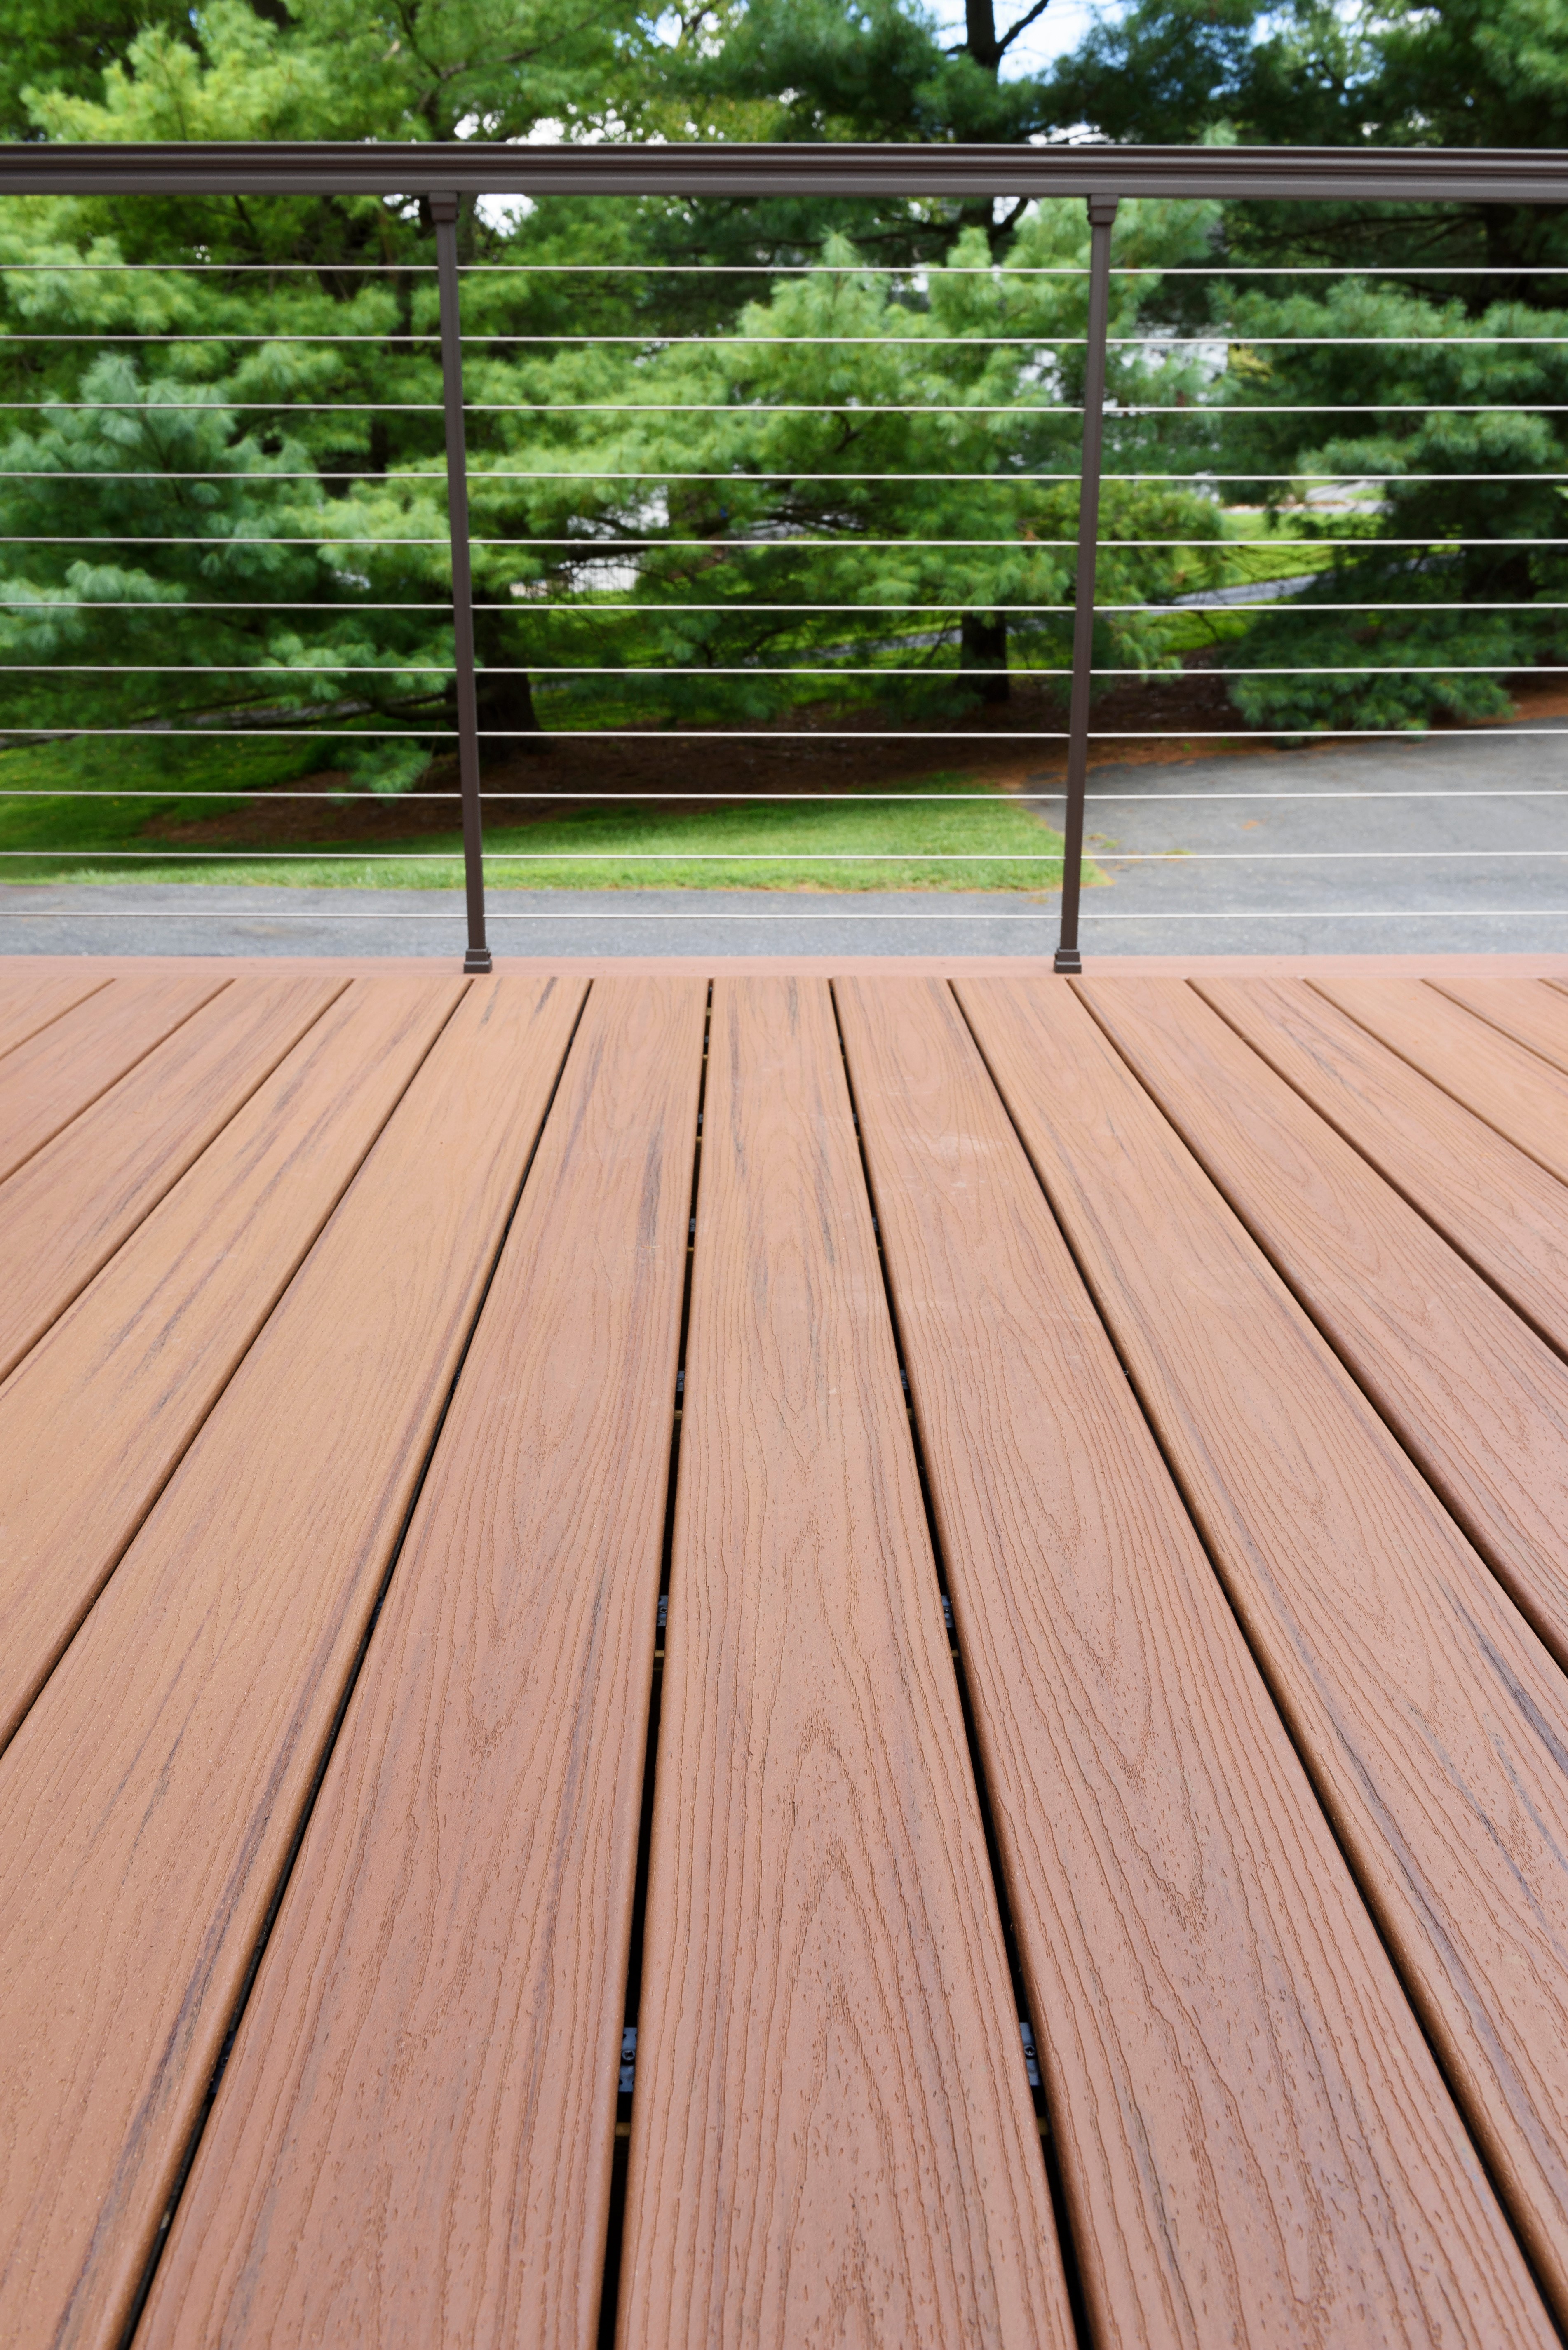
Building a 320-square-foot composite deck with concrete piers, as well as stairs and a built-in bench and planter.
$0
$0
0%
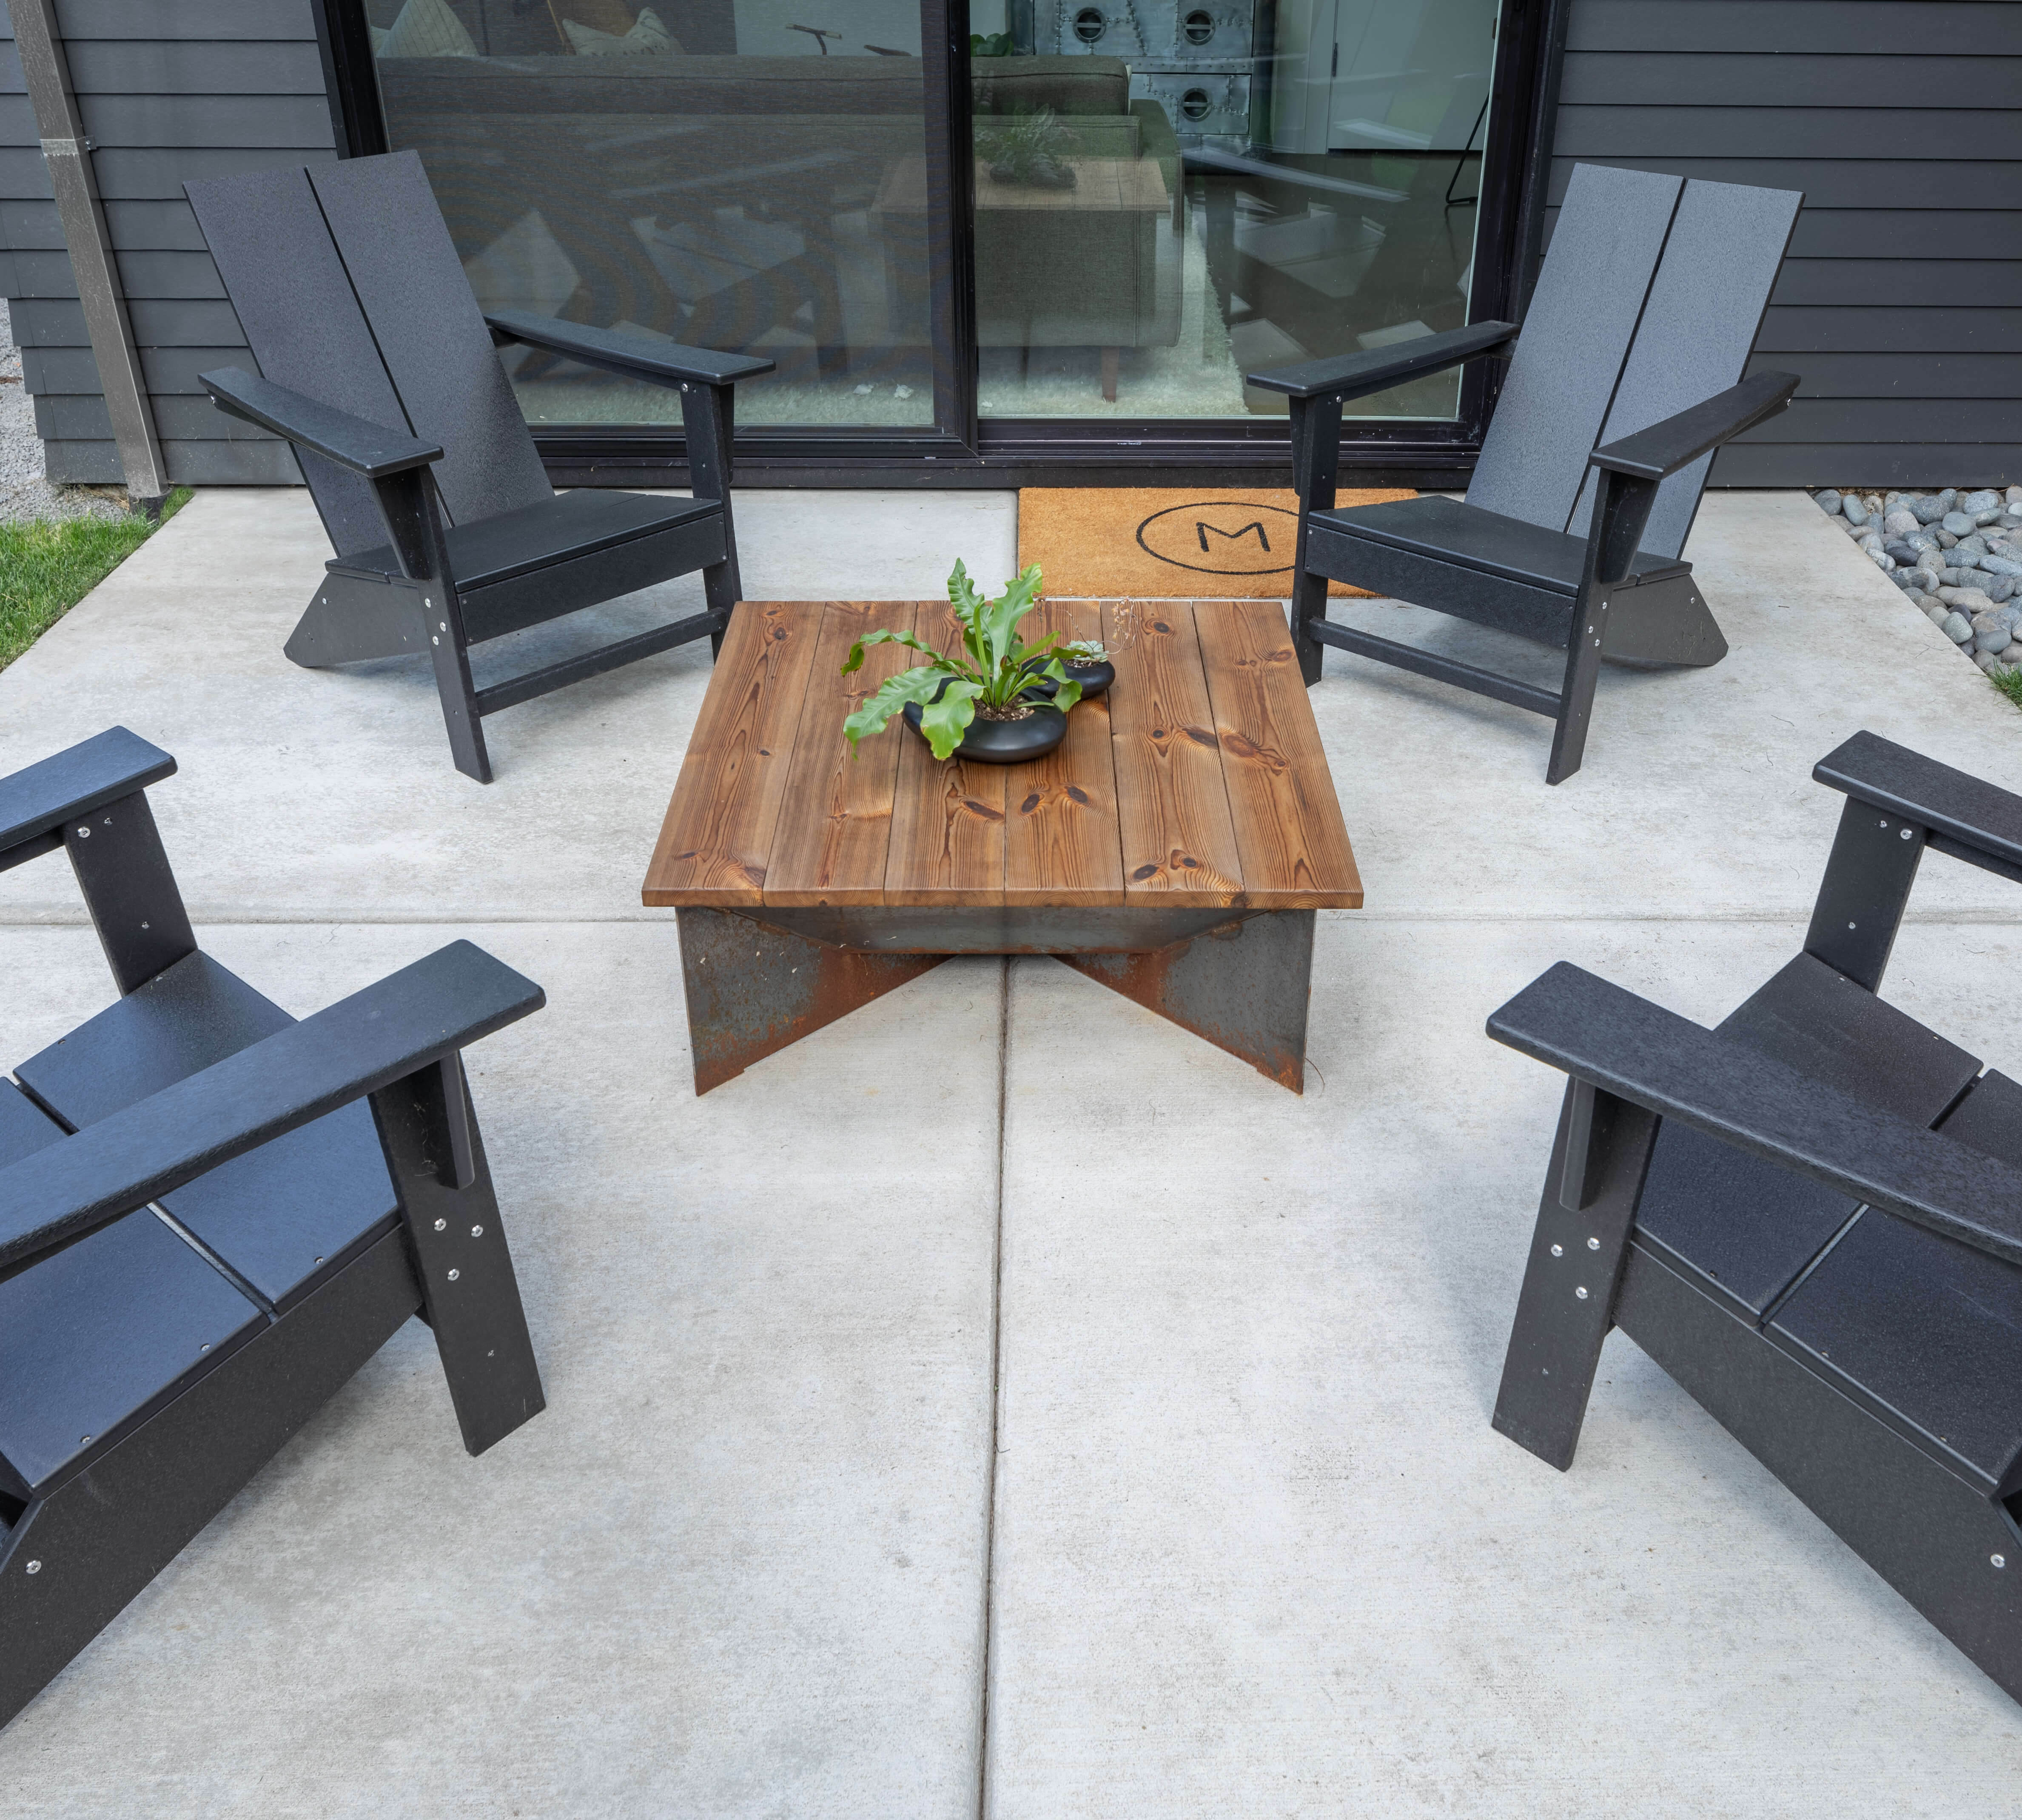
Leveling a 16x20-foot area of the backyard and pouring concrete to create a patio.
$0
$0
0%
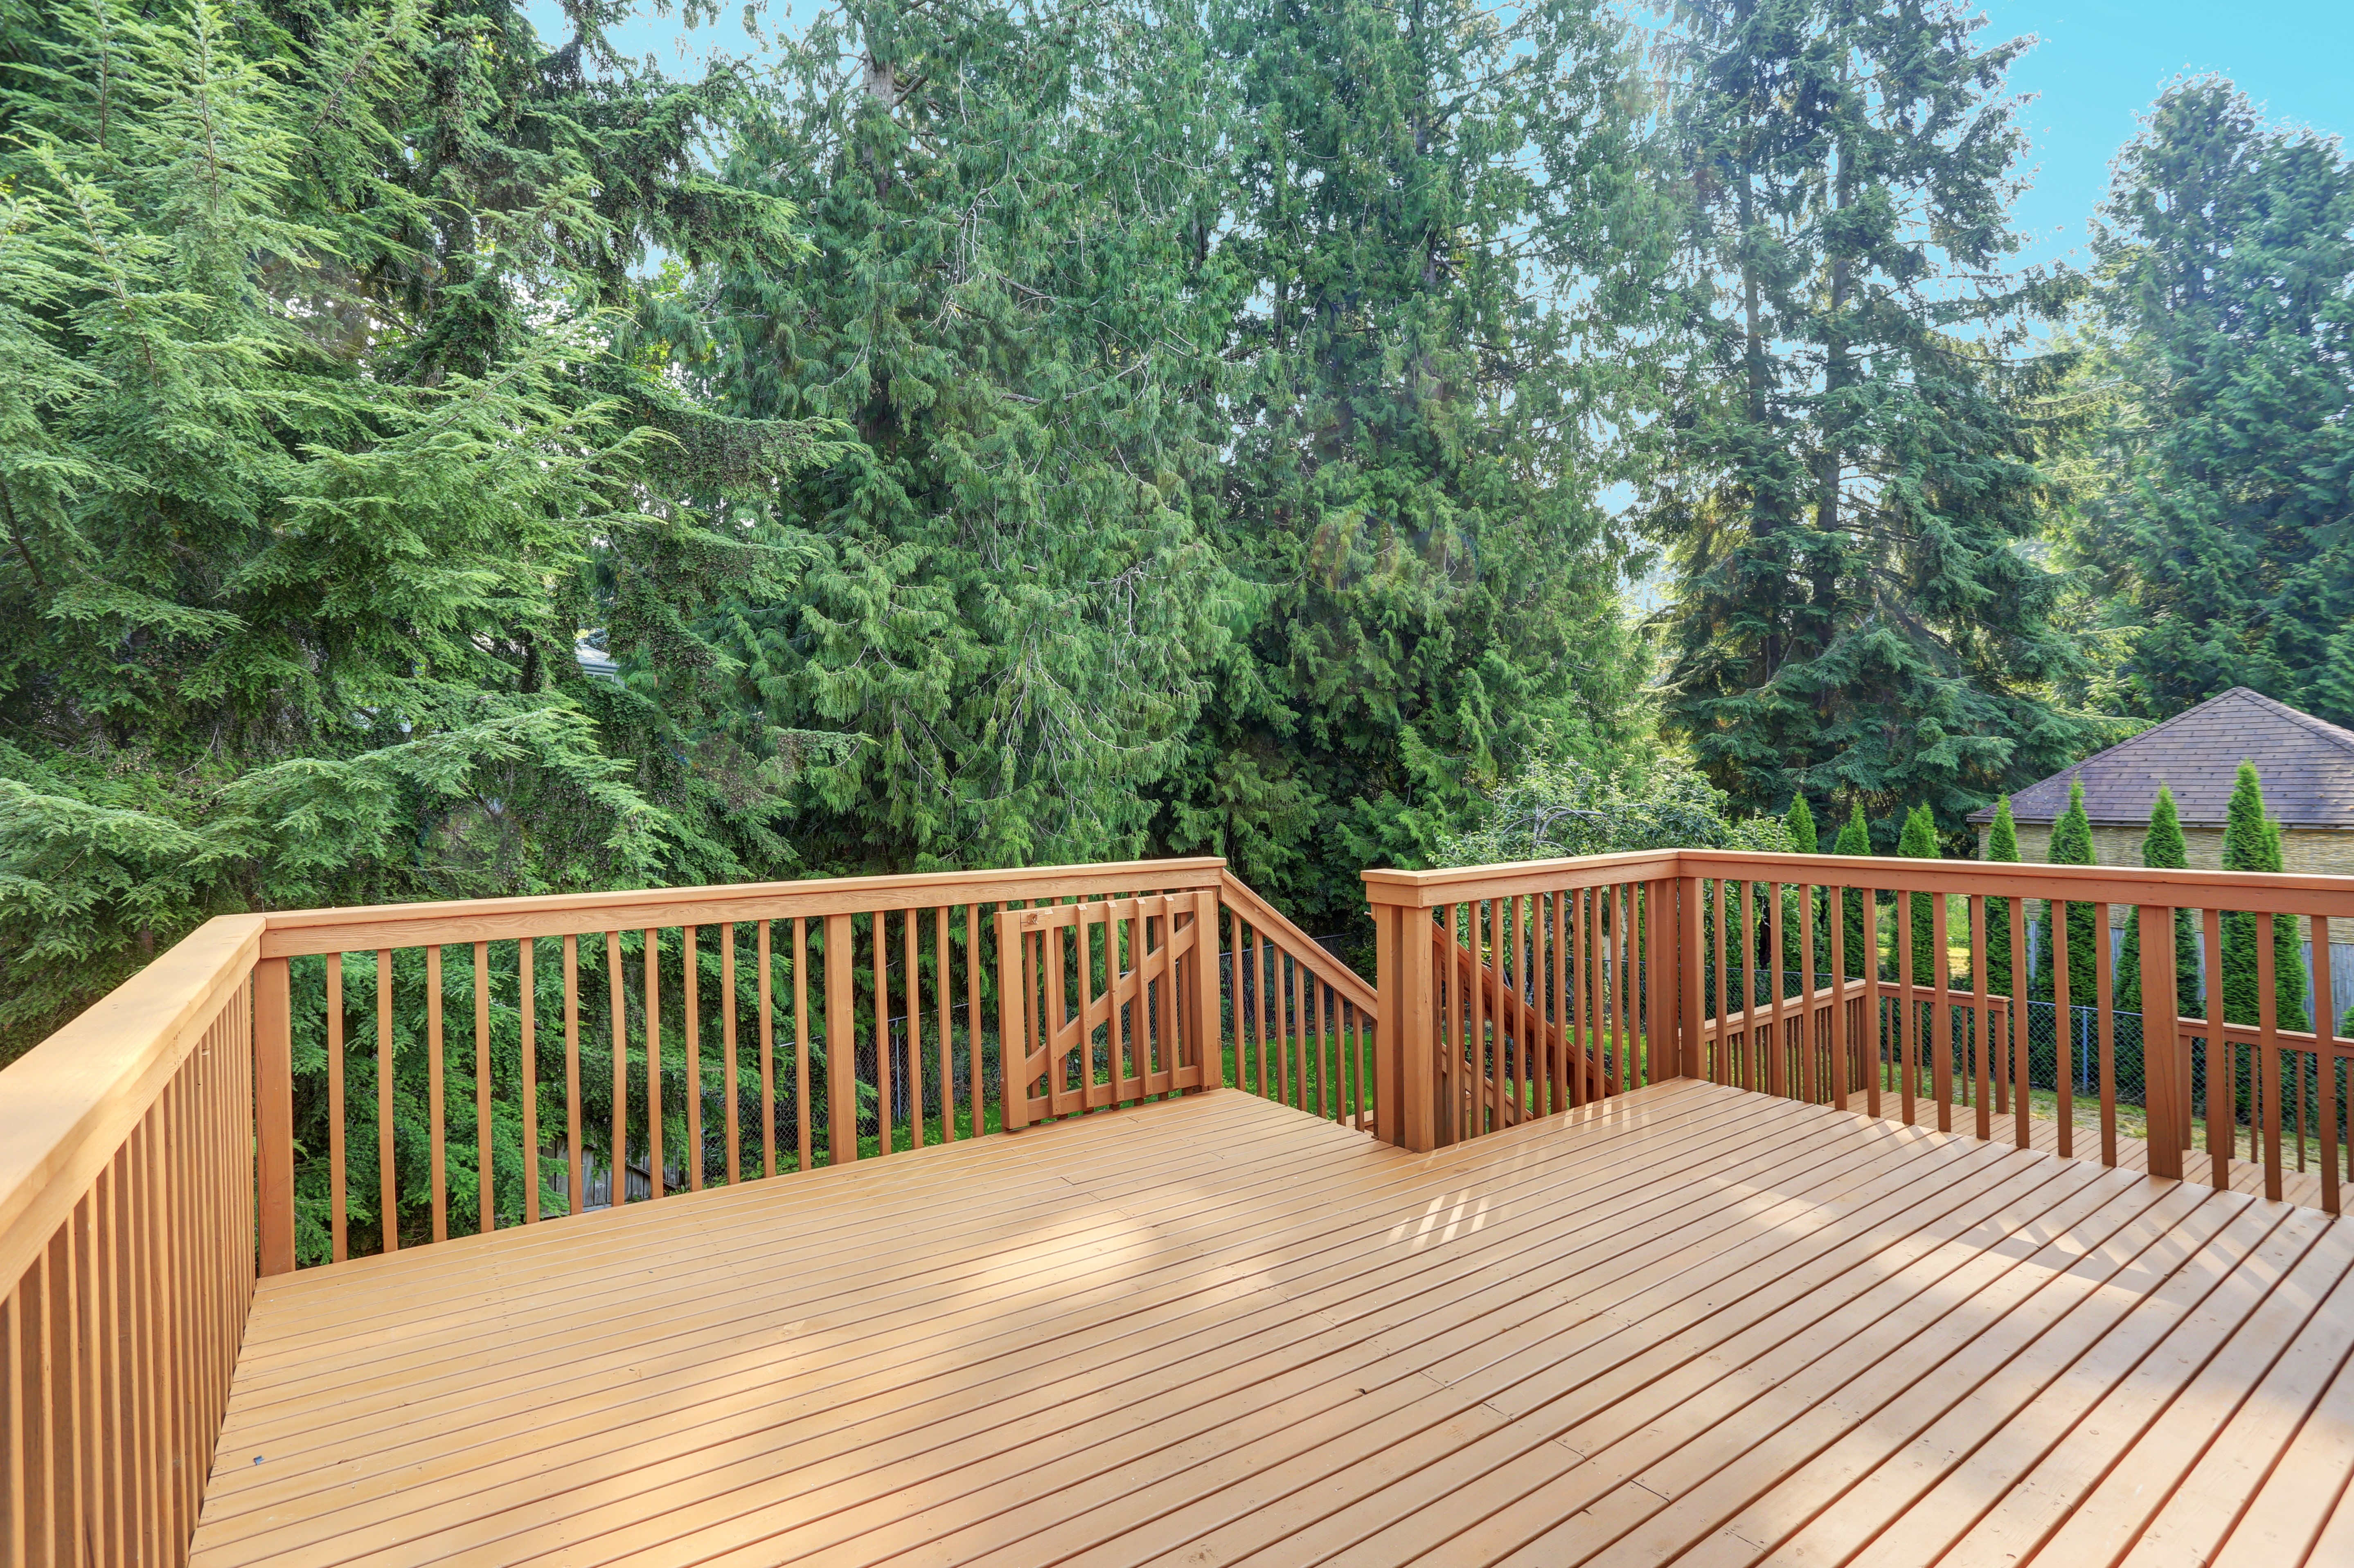
Adding a 320-square-foot wood deck with stairs and a railing system to your home.
$0
$0
0%
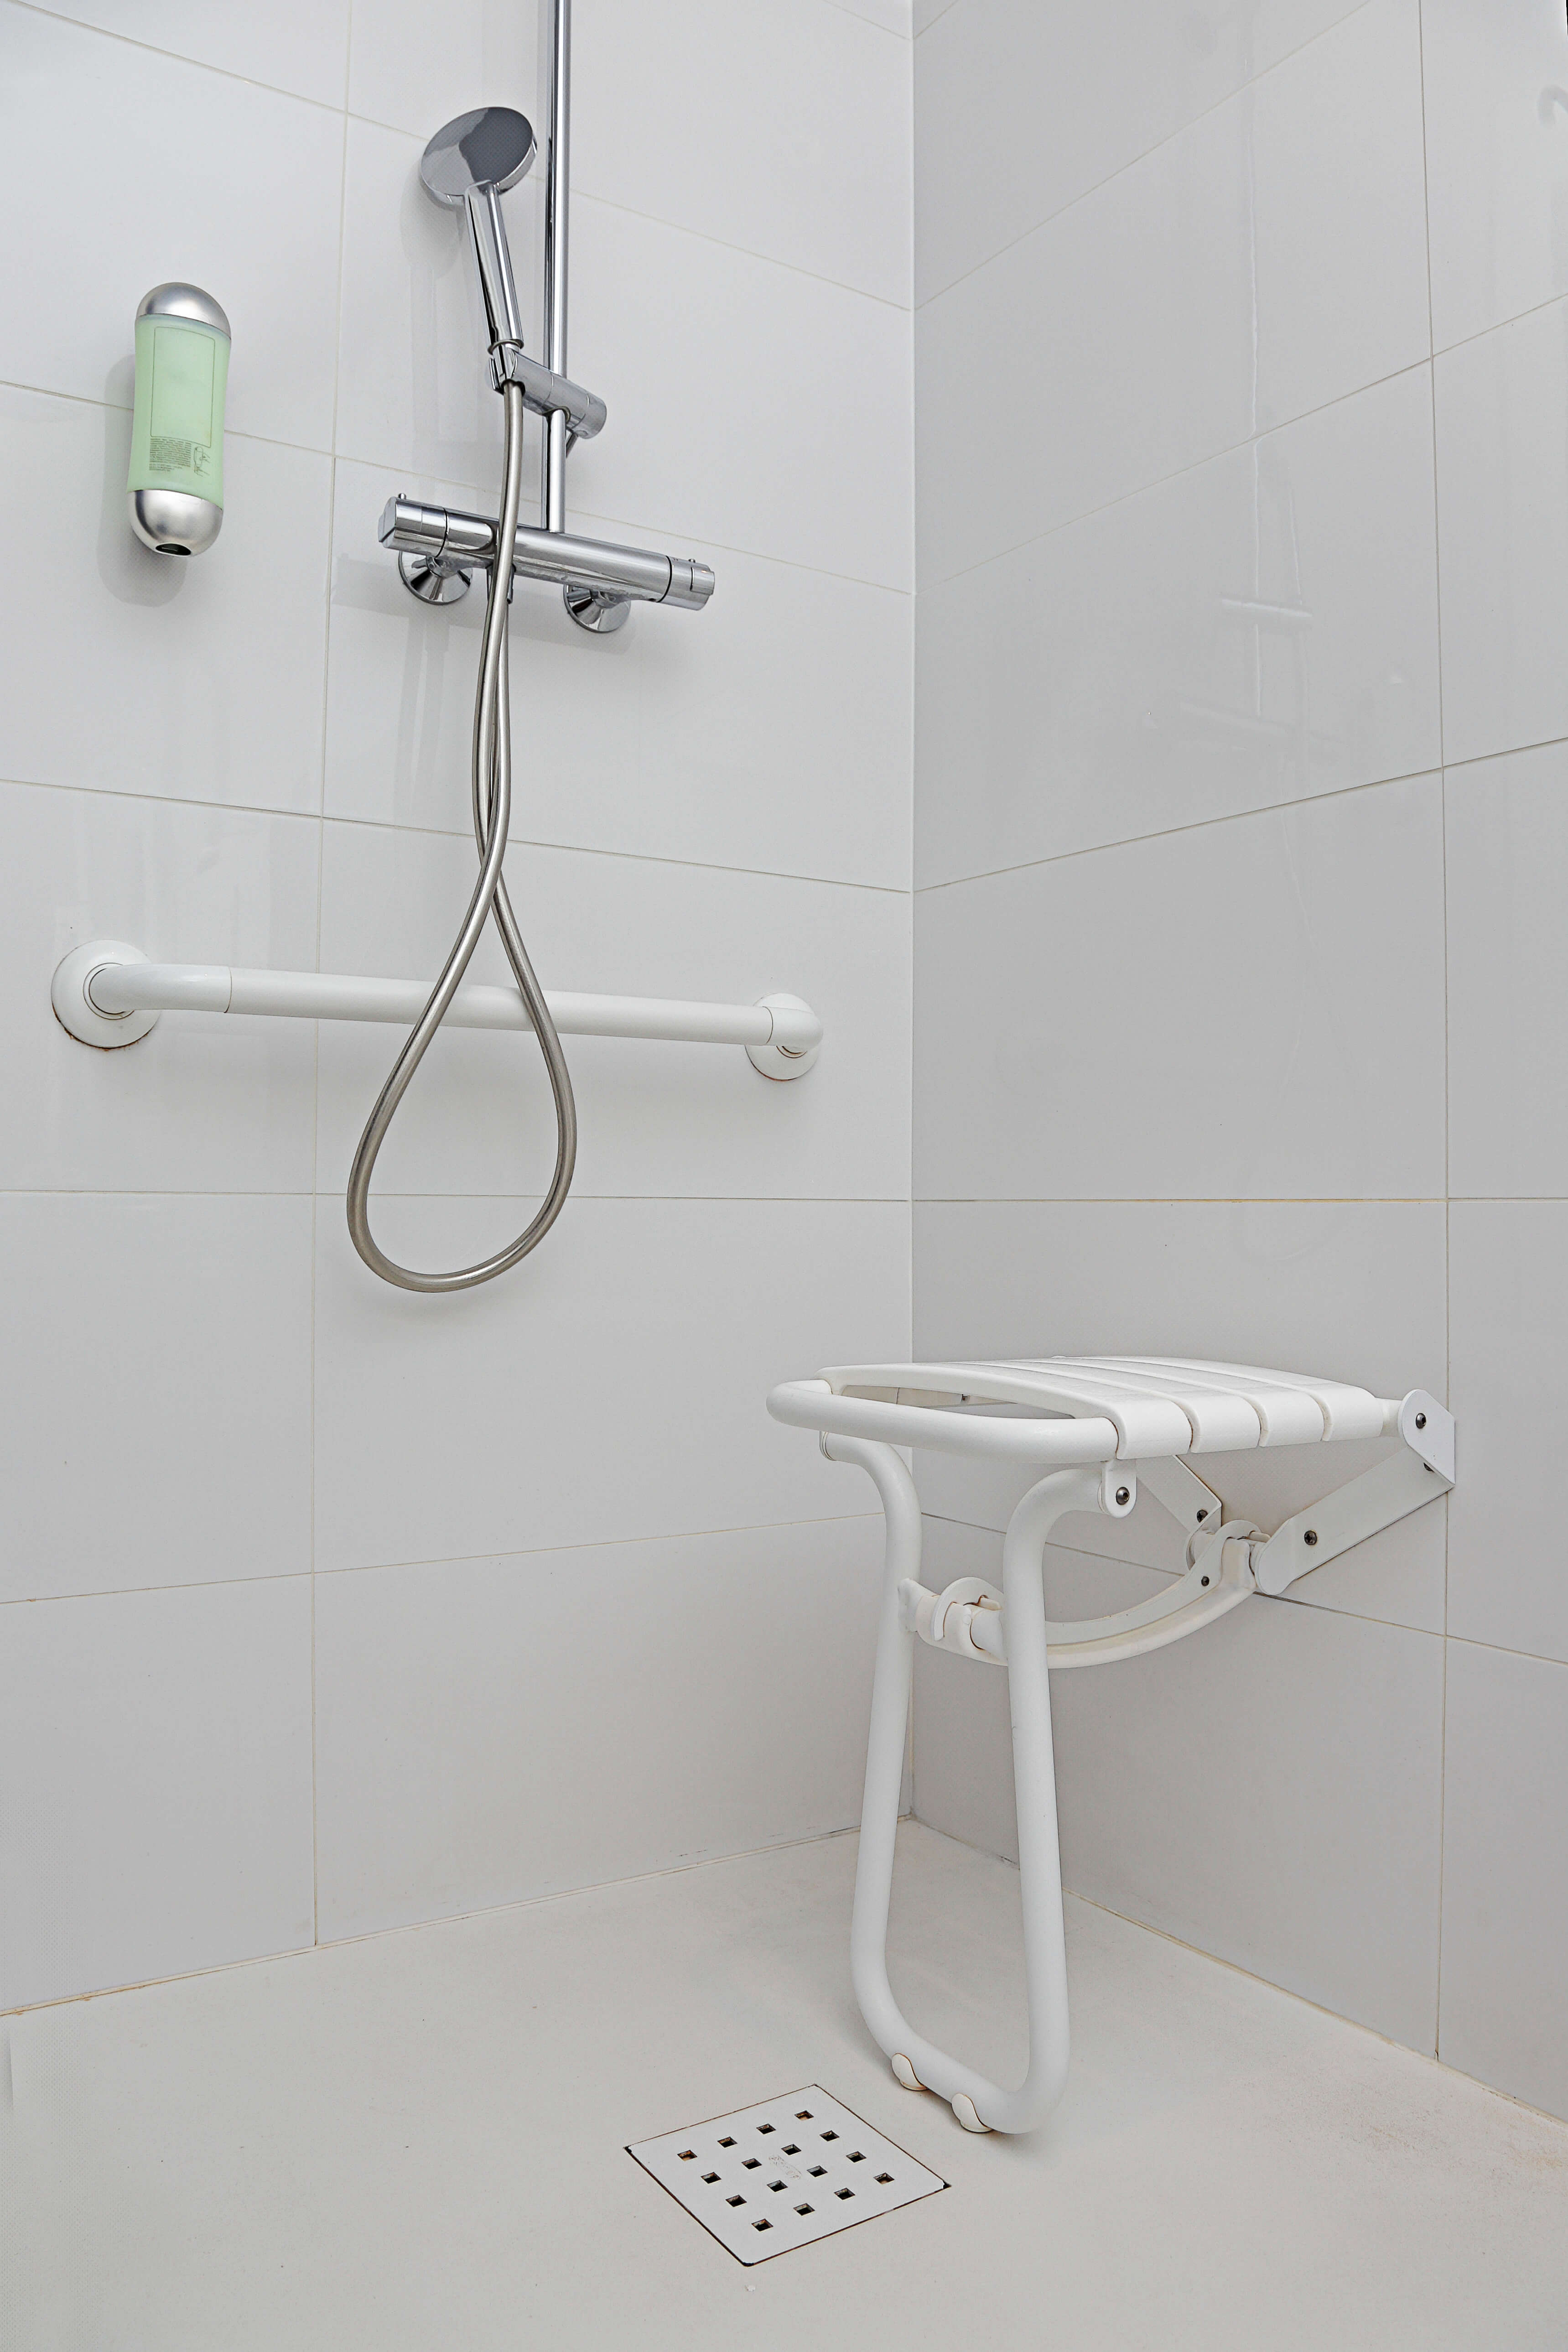
Making a bathroom handicap accessible, with wider doors and a wheelchair-accessible toilet and shower, along with various cosmetic improvements.
$0
$0
0%
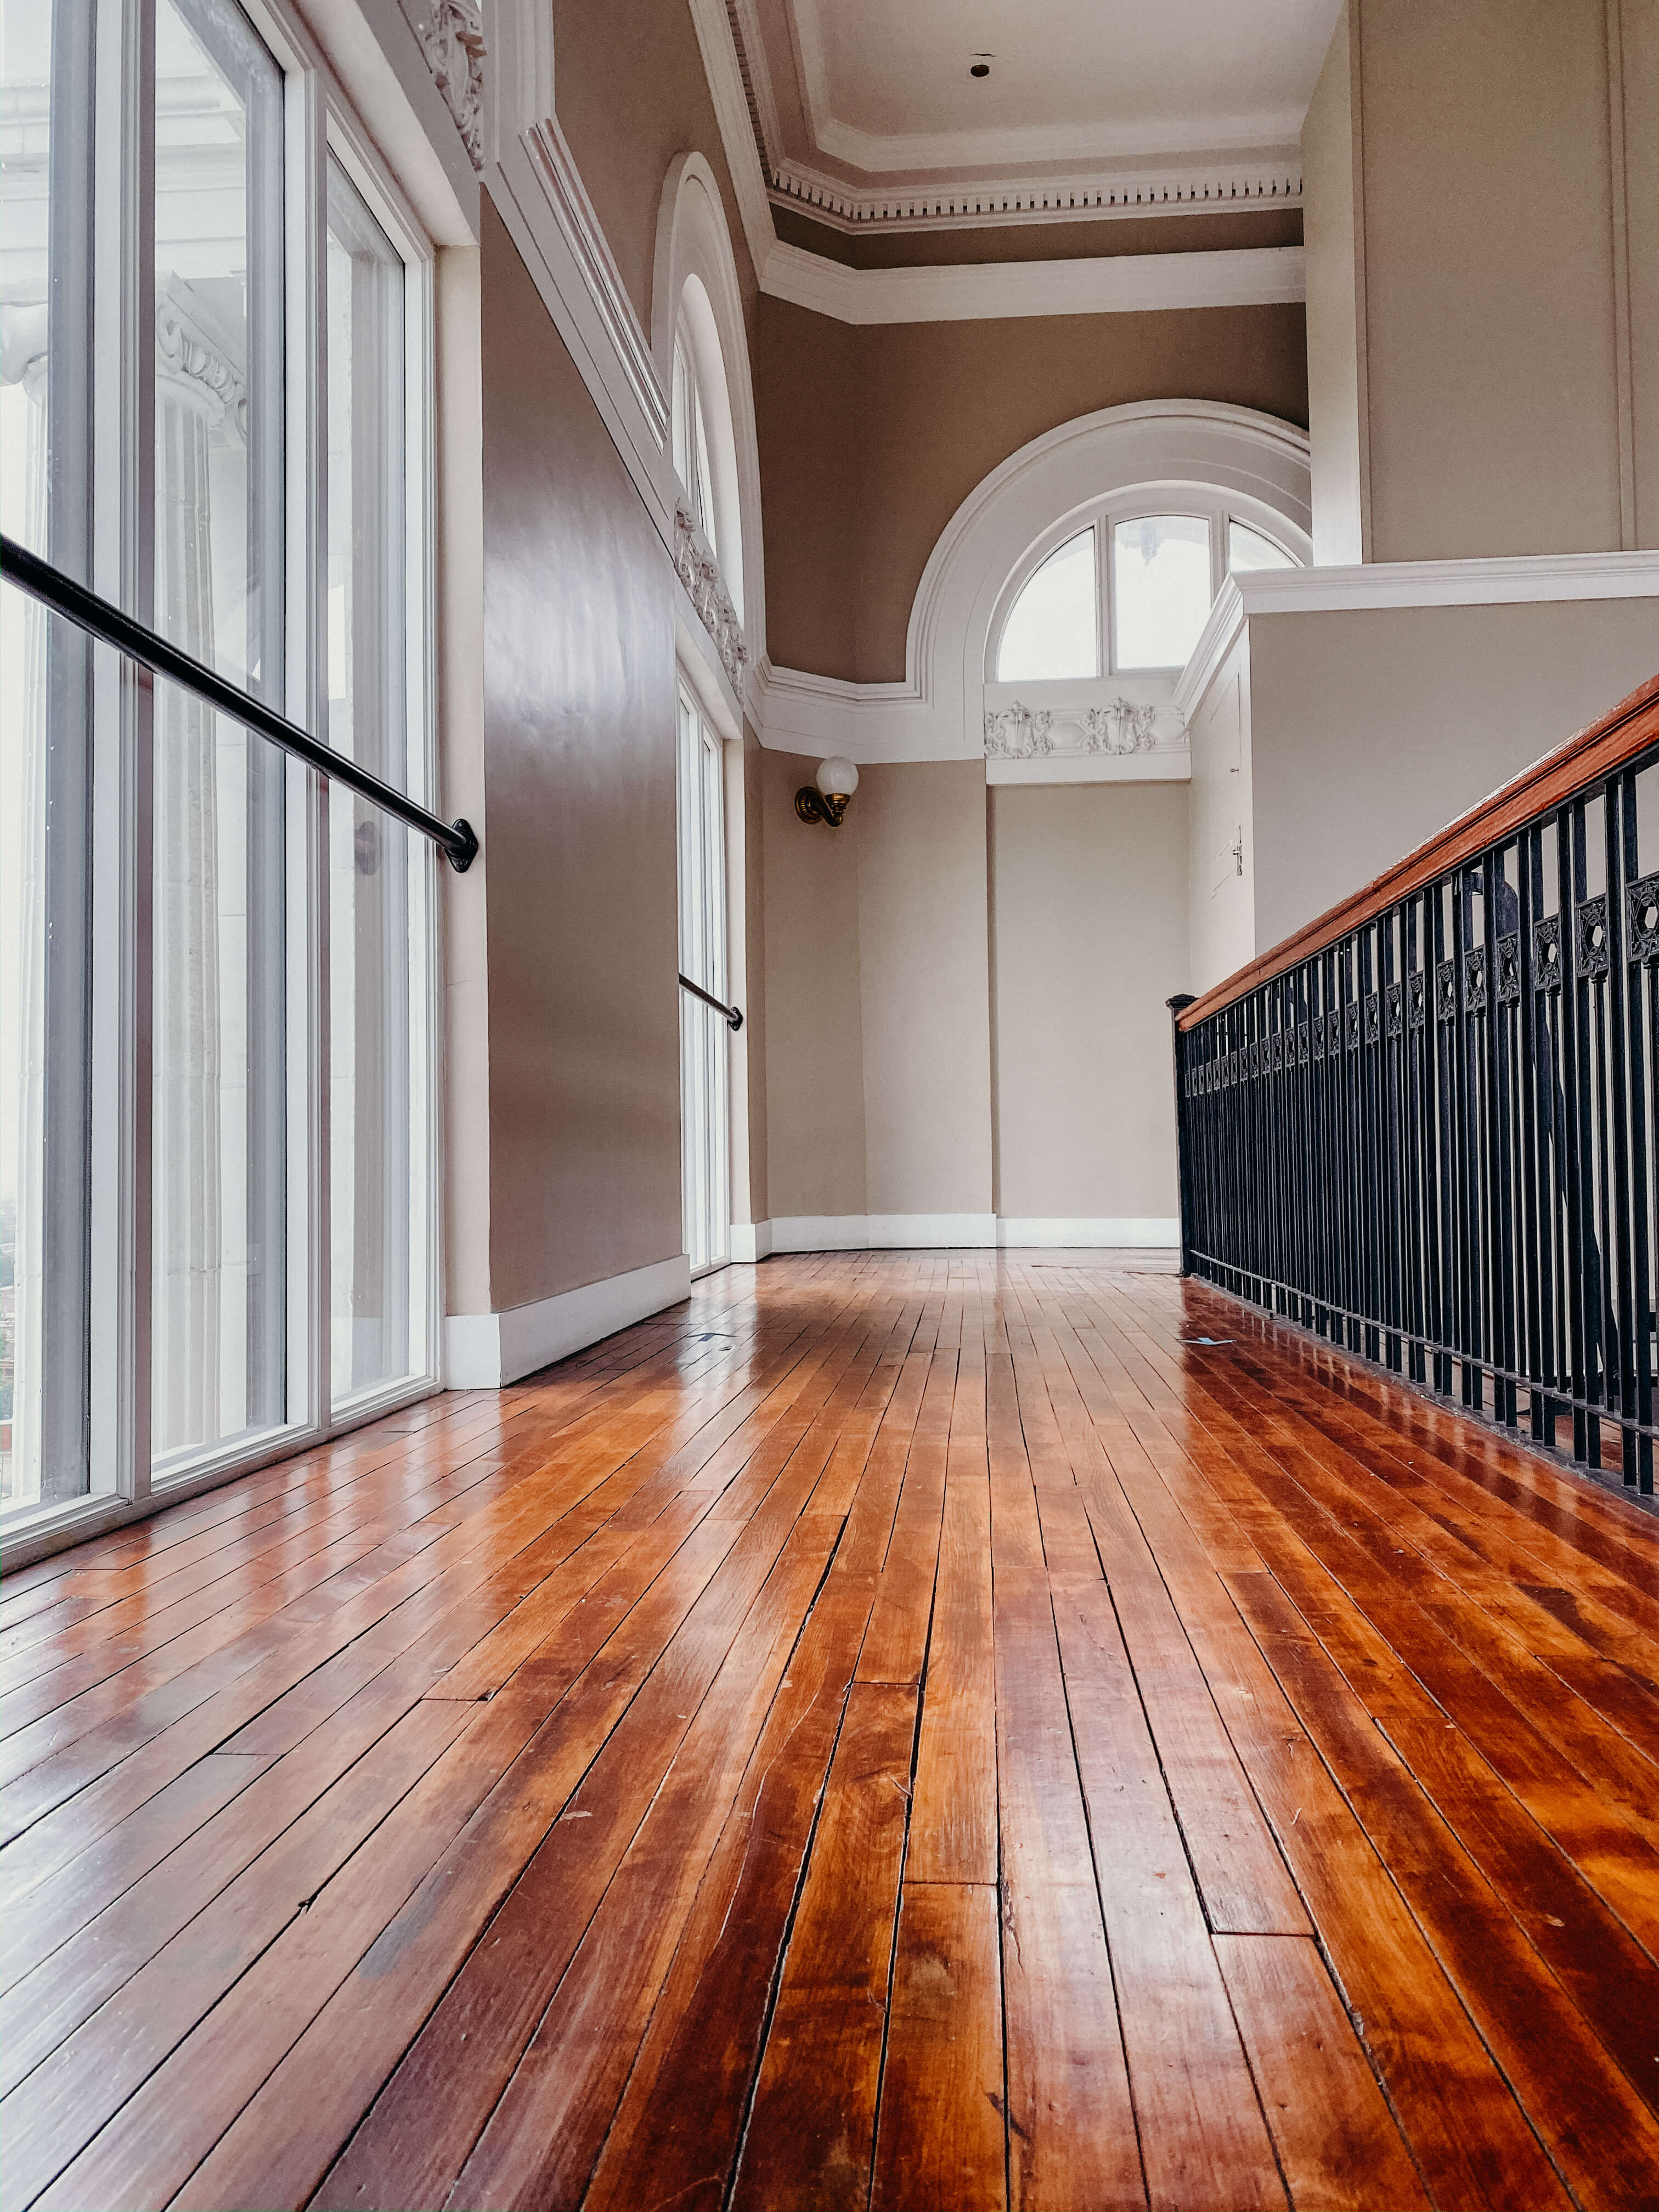
Removing 200 square feet of existing flooring and replacing it with new hardwood flooring.
$0
$0
0%
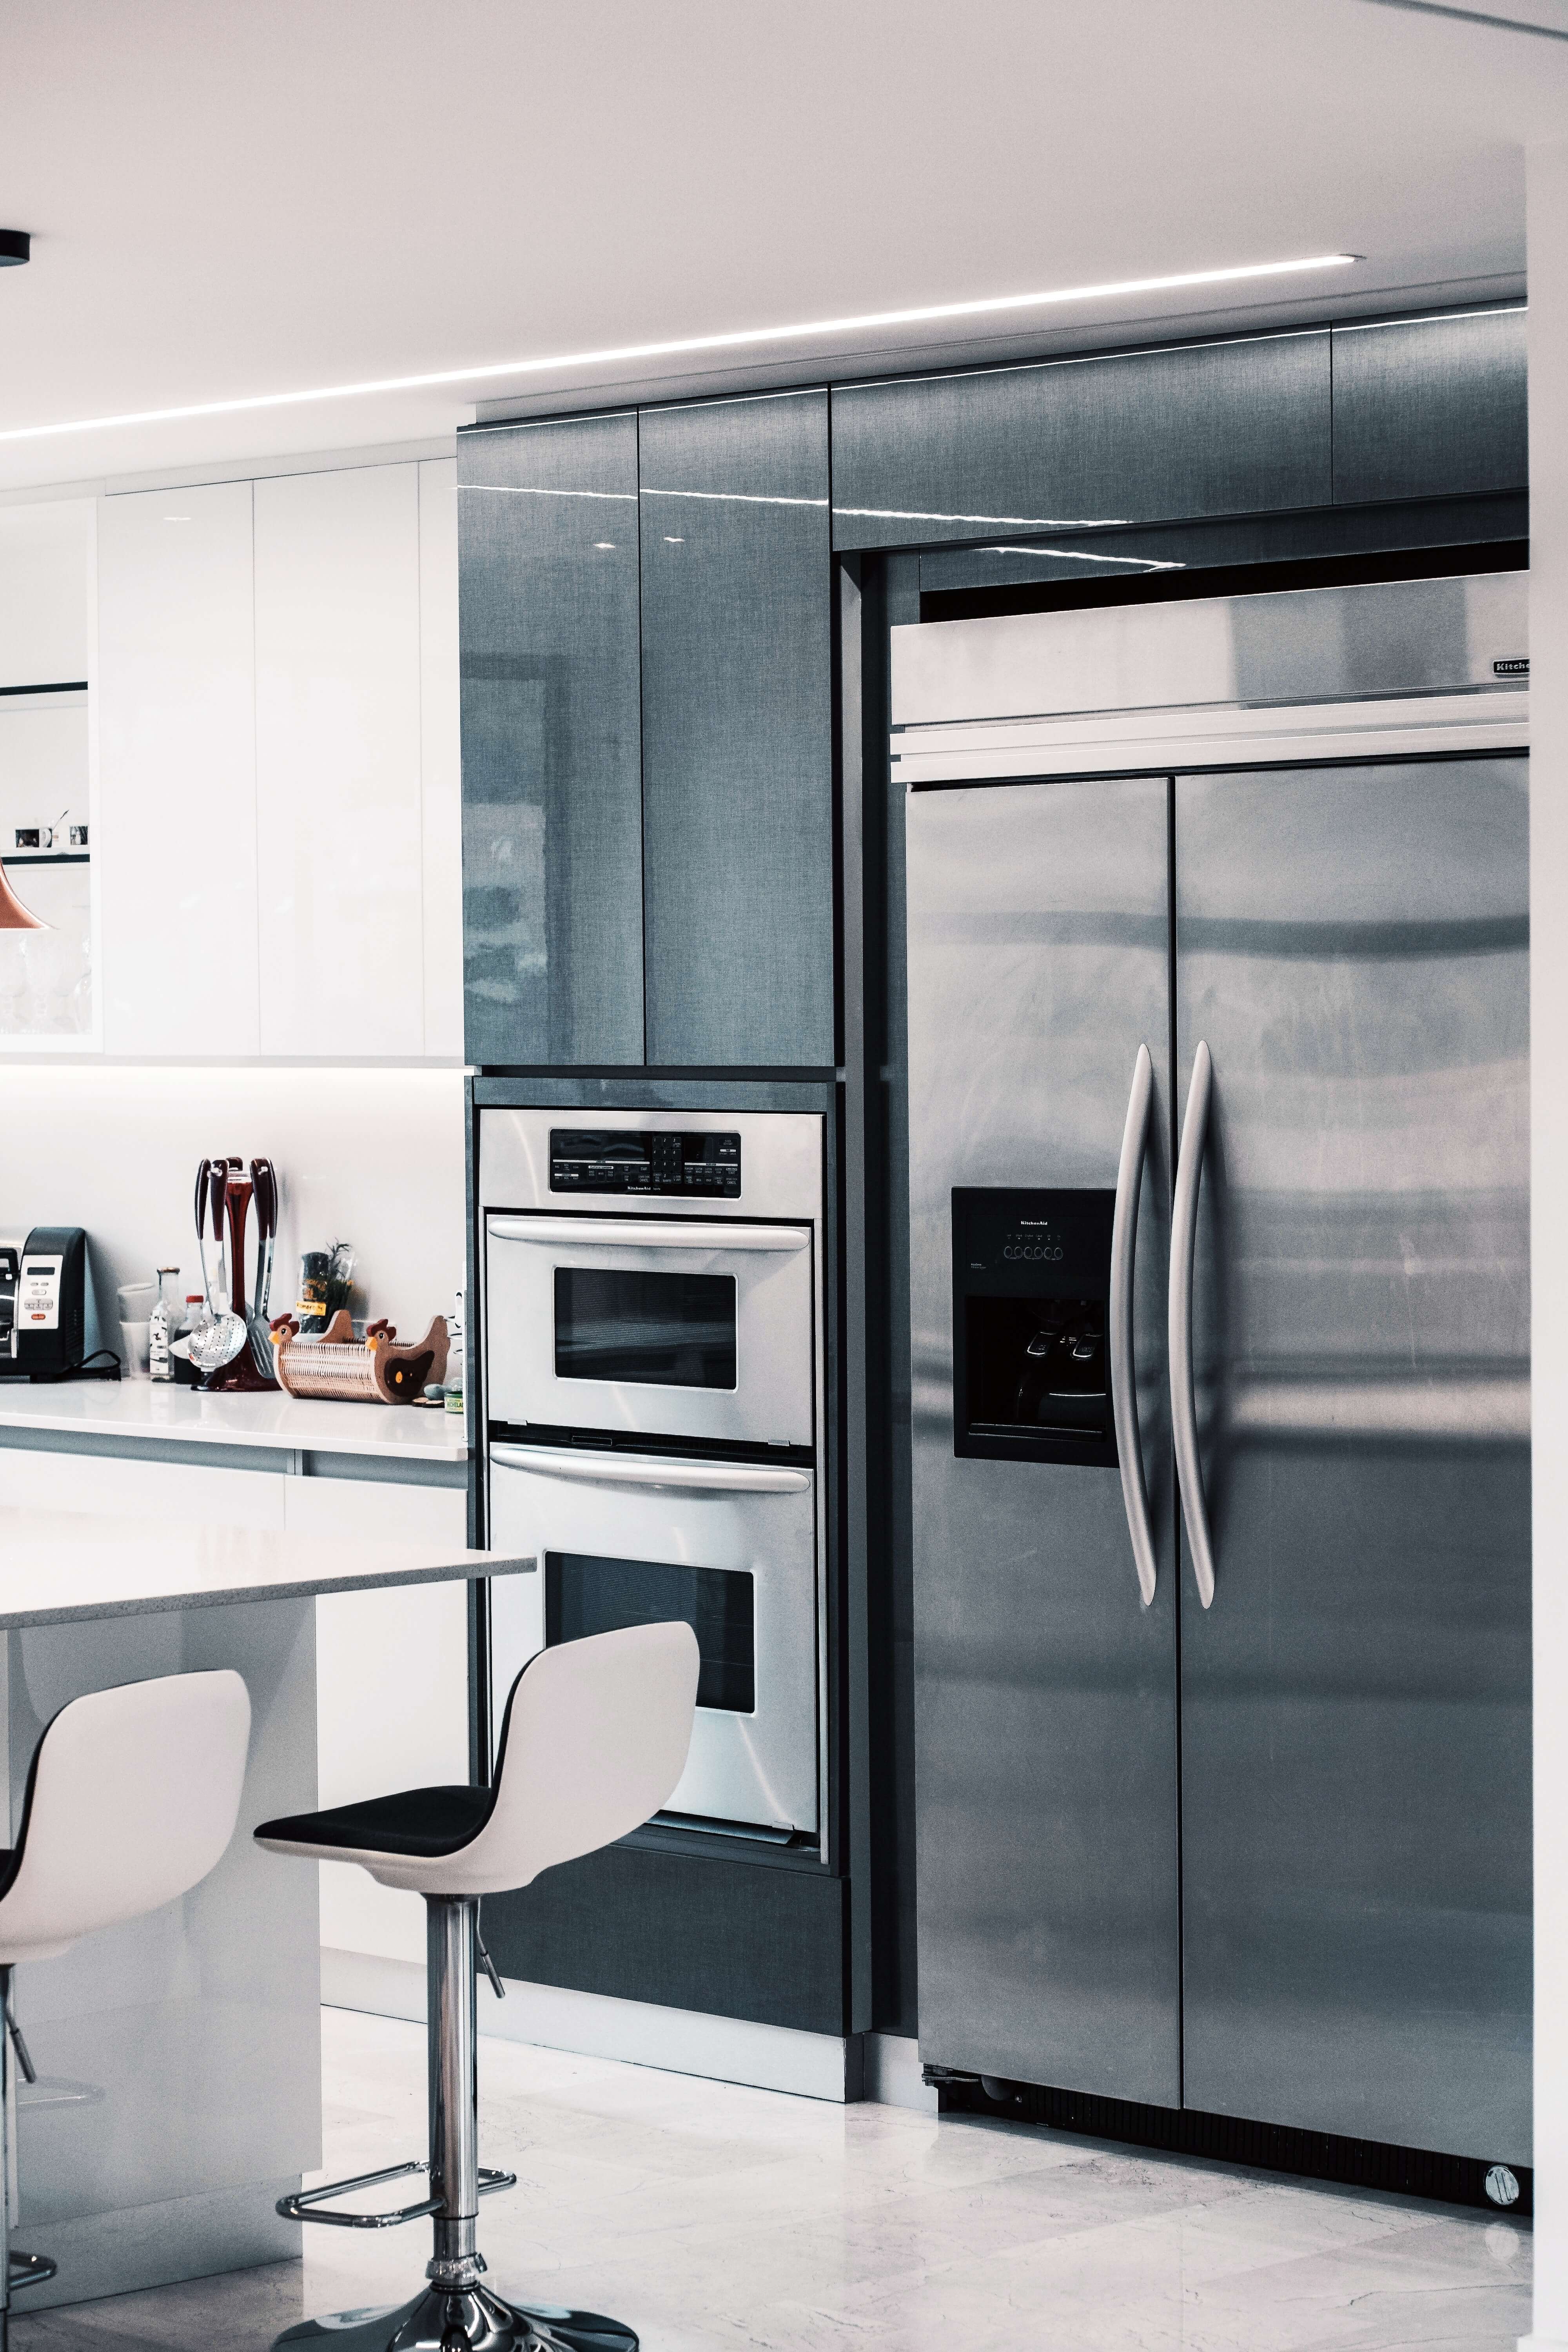
Upgrading your kitchen with stainless steel appliances, including a smart refrigerator, gas range with a steam-cleaning oven, microwave, and three-rack dishwasher.
$0
$0
0%
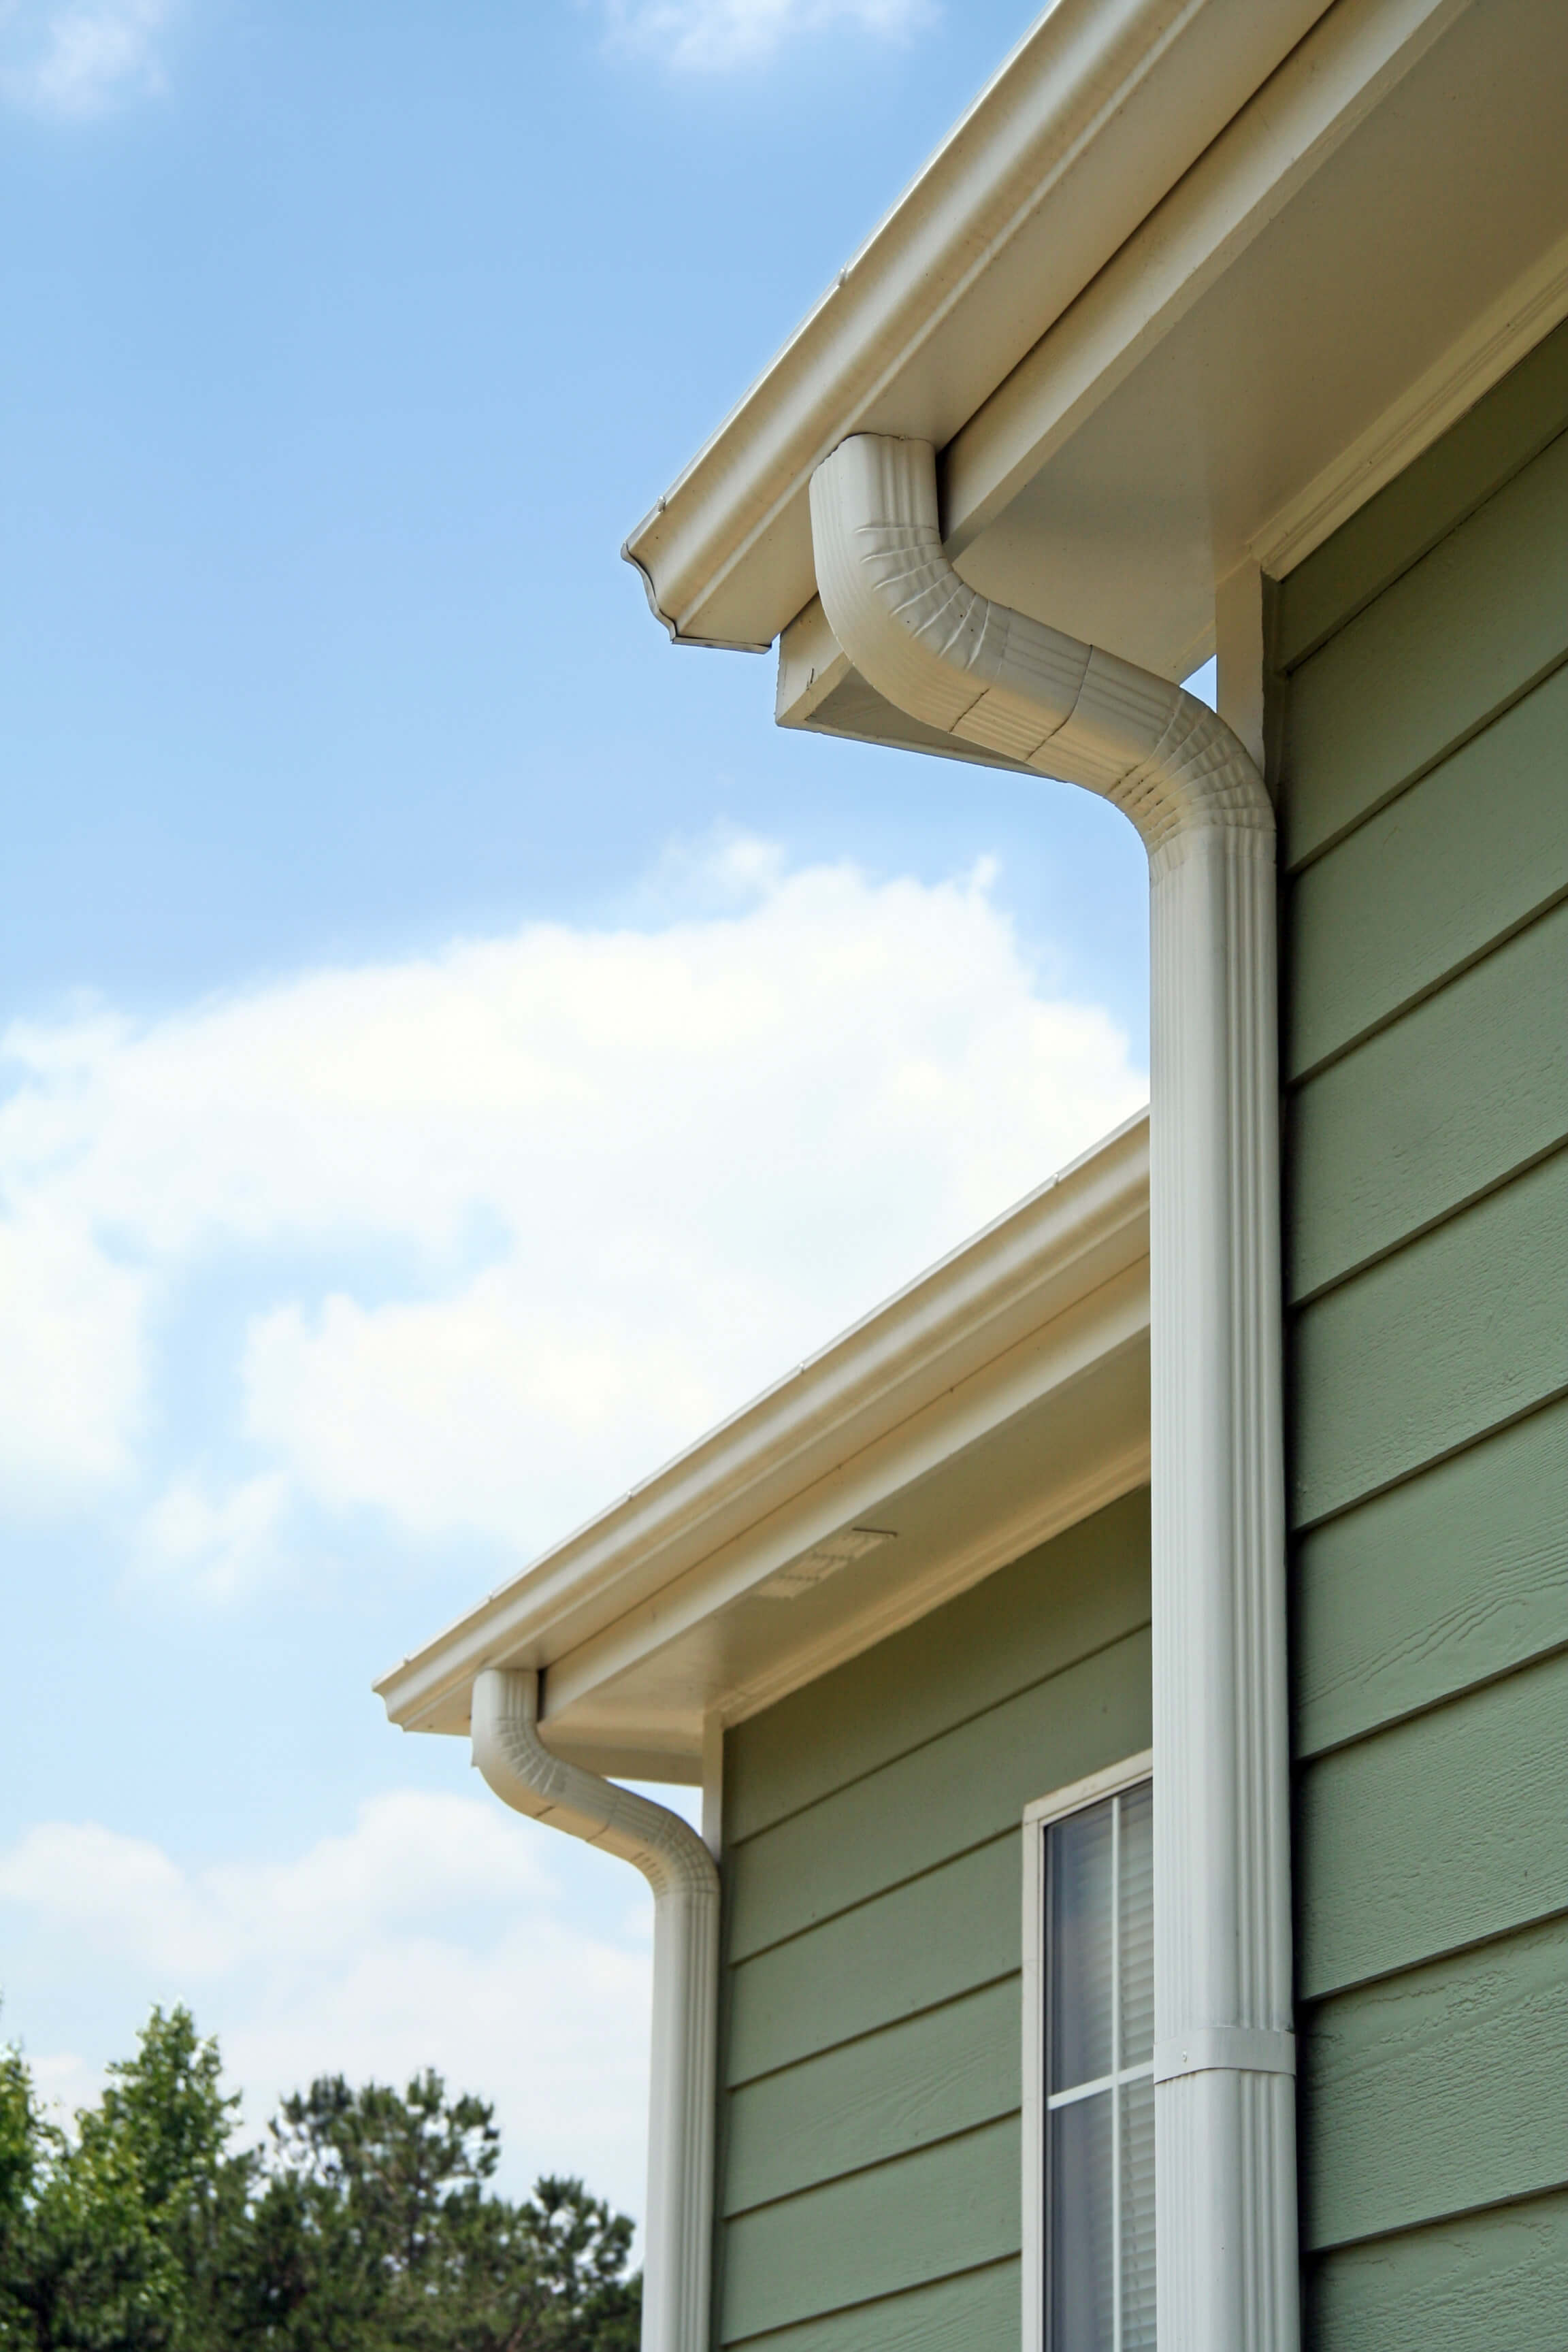
Removing existing gutters and installing new ones around the perimeter of your home.
$0
$0
0%
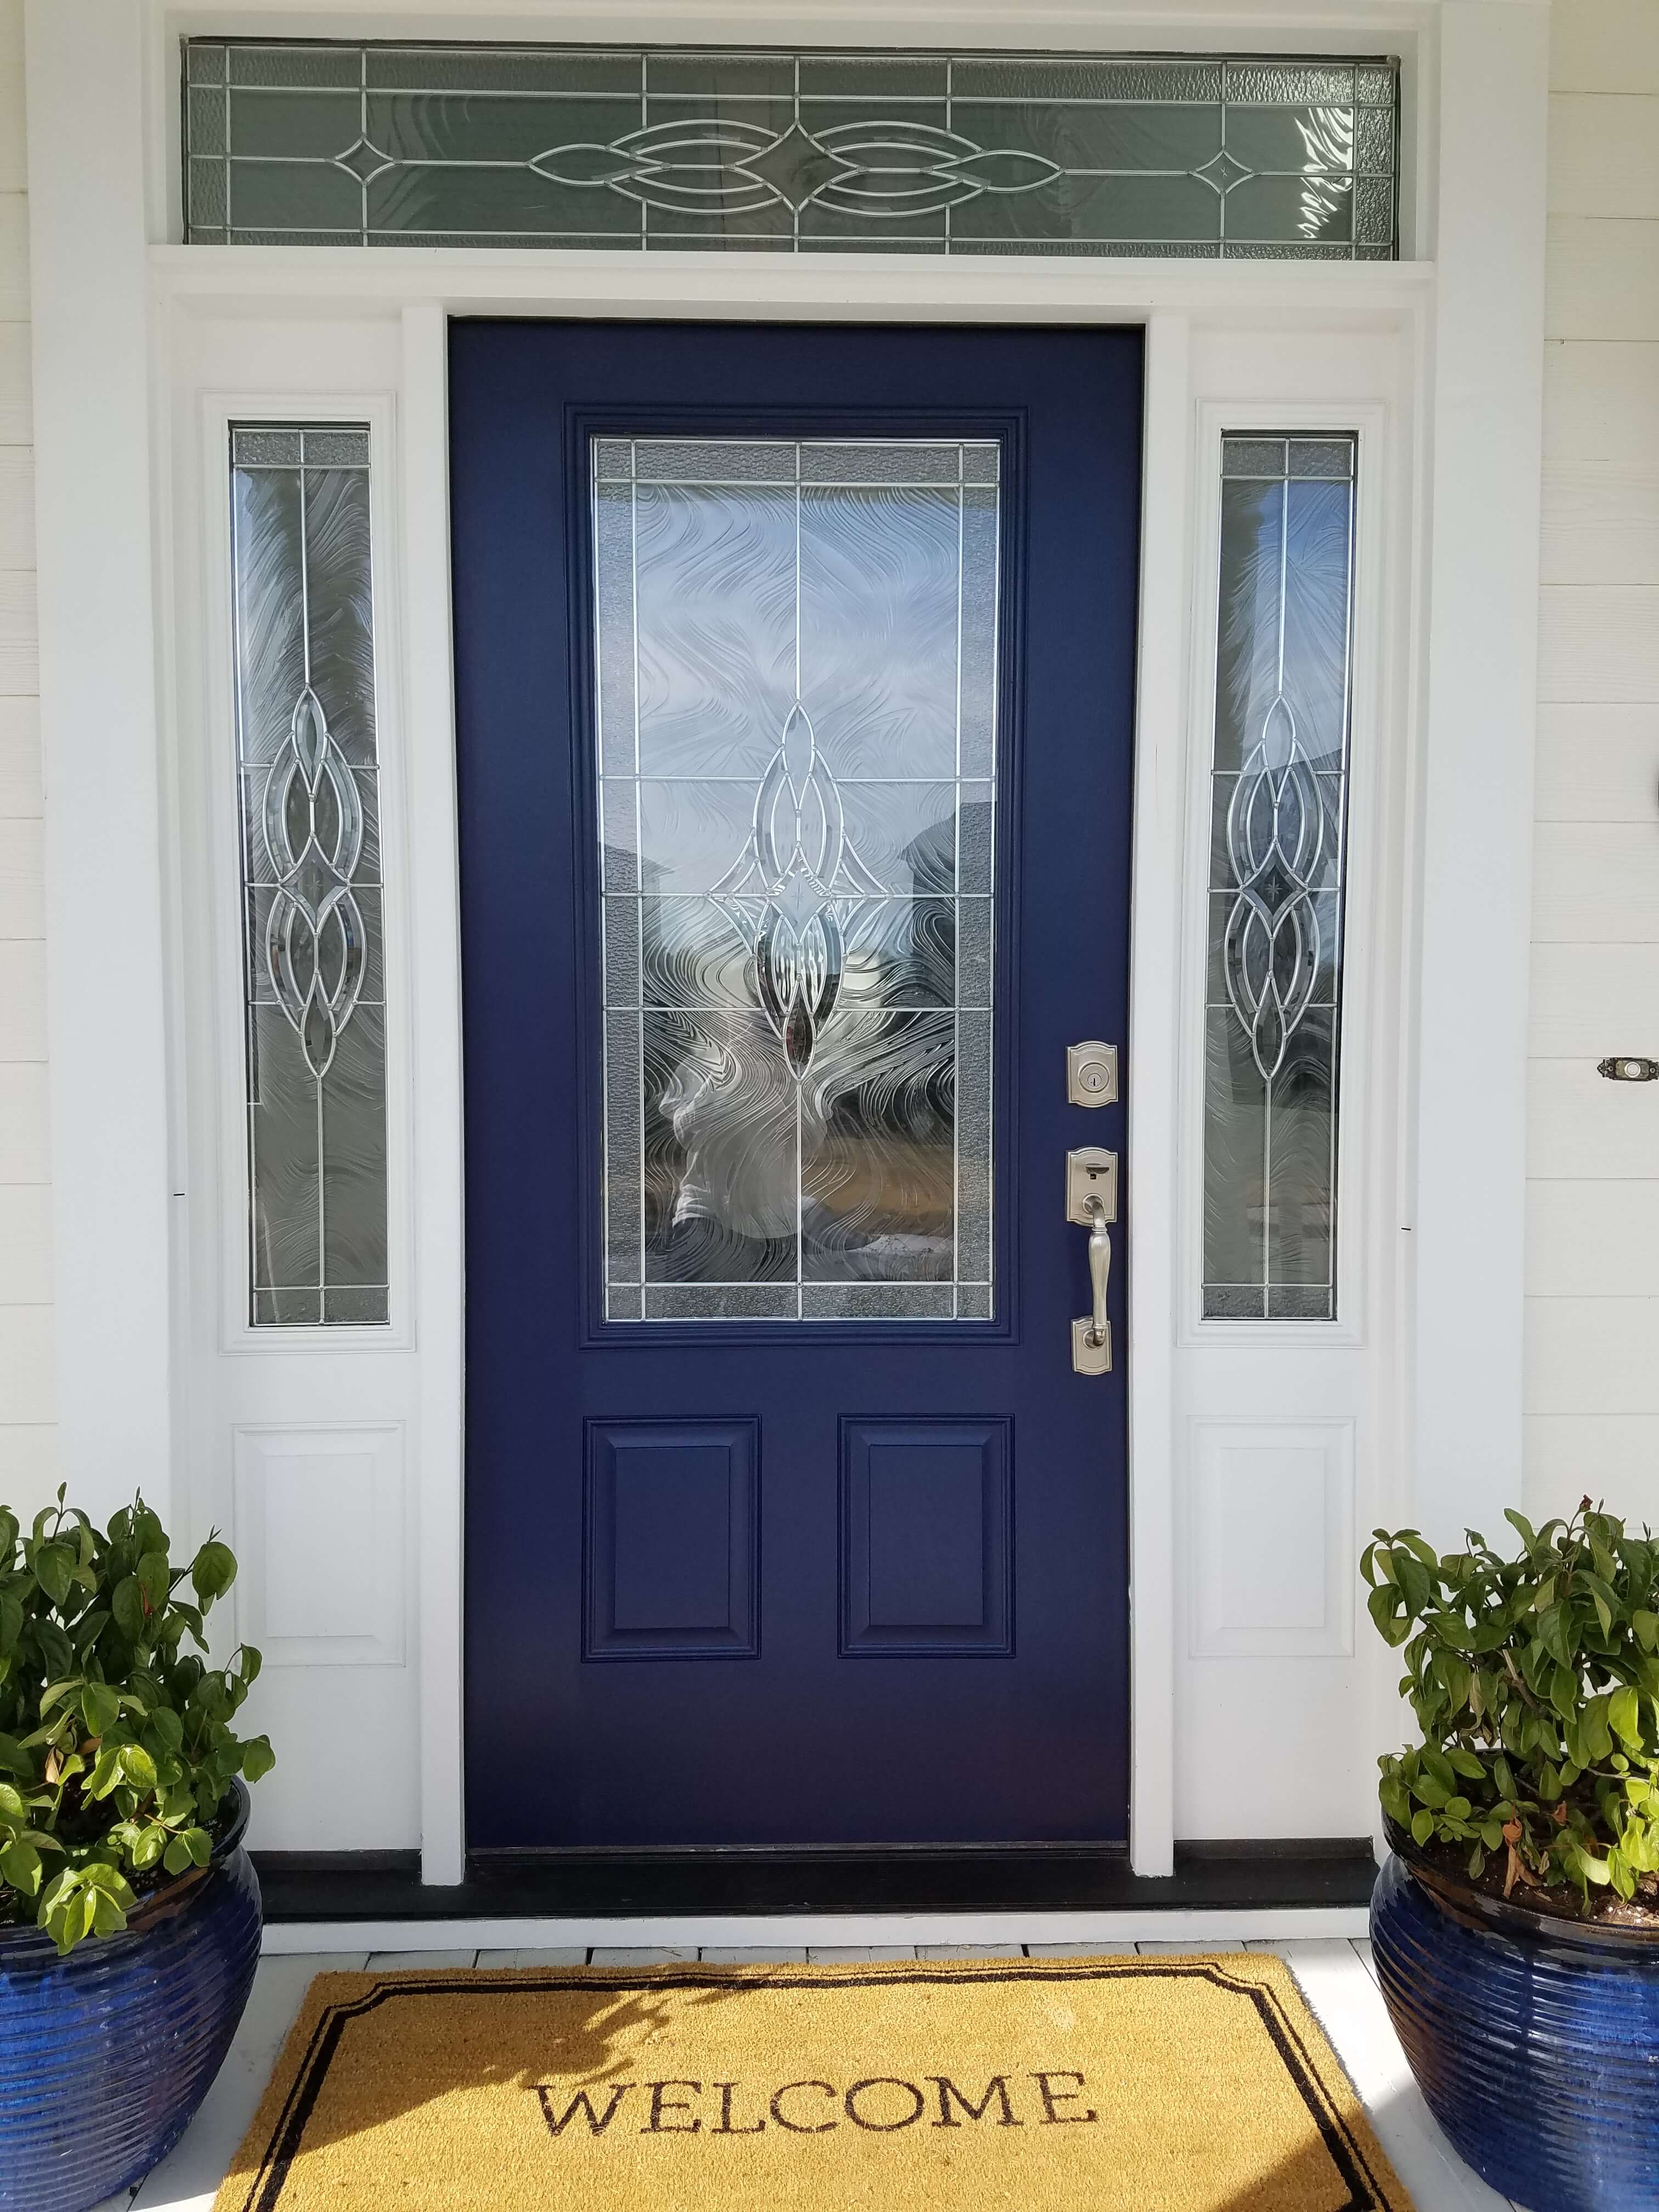
Widening an existing door frame and installing a 36x80-inch fiberglass door as well as two sidelights. The interior and exterior area around the entryway will also be updated to match the quality of this new upscale entrance.
$0
$0
0%
Stripping your existing rectangular hip roof to bare wood sheathing and installing all-new asphalt roofing components, including the underlayment and shingles.
$0
$0
0%
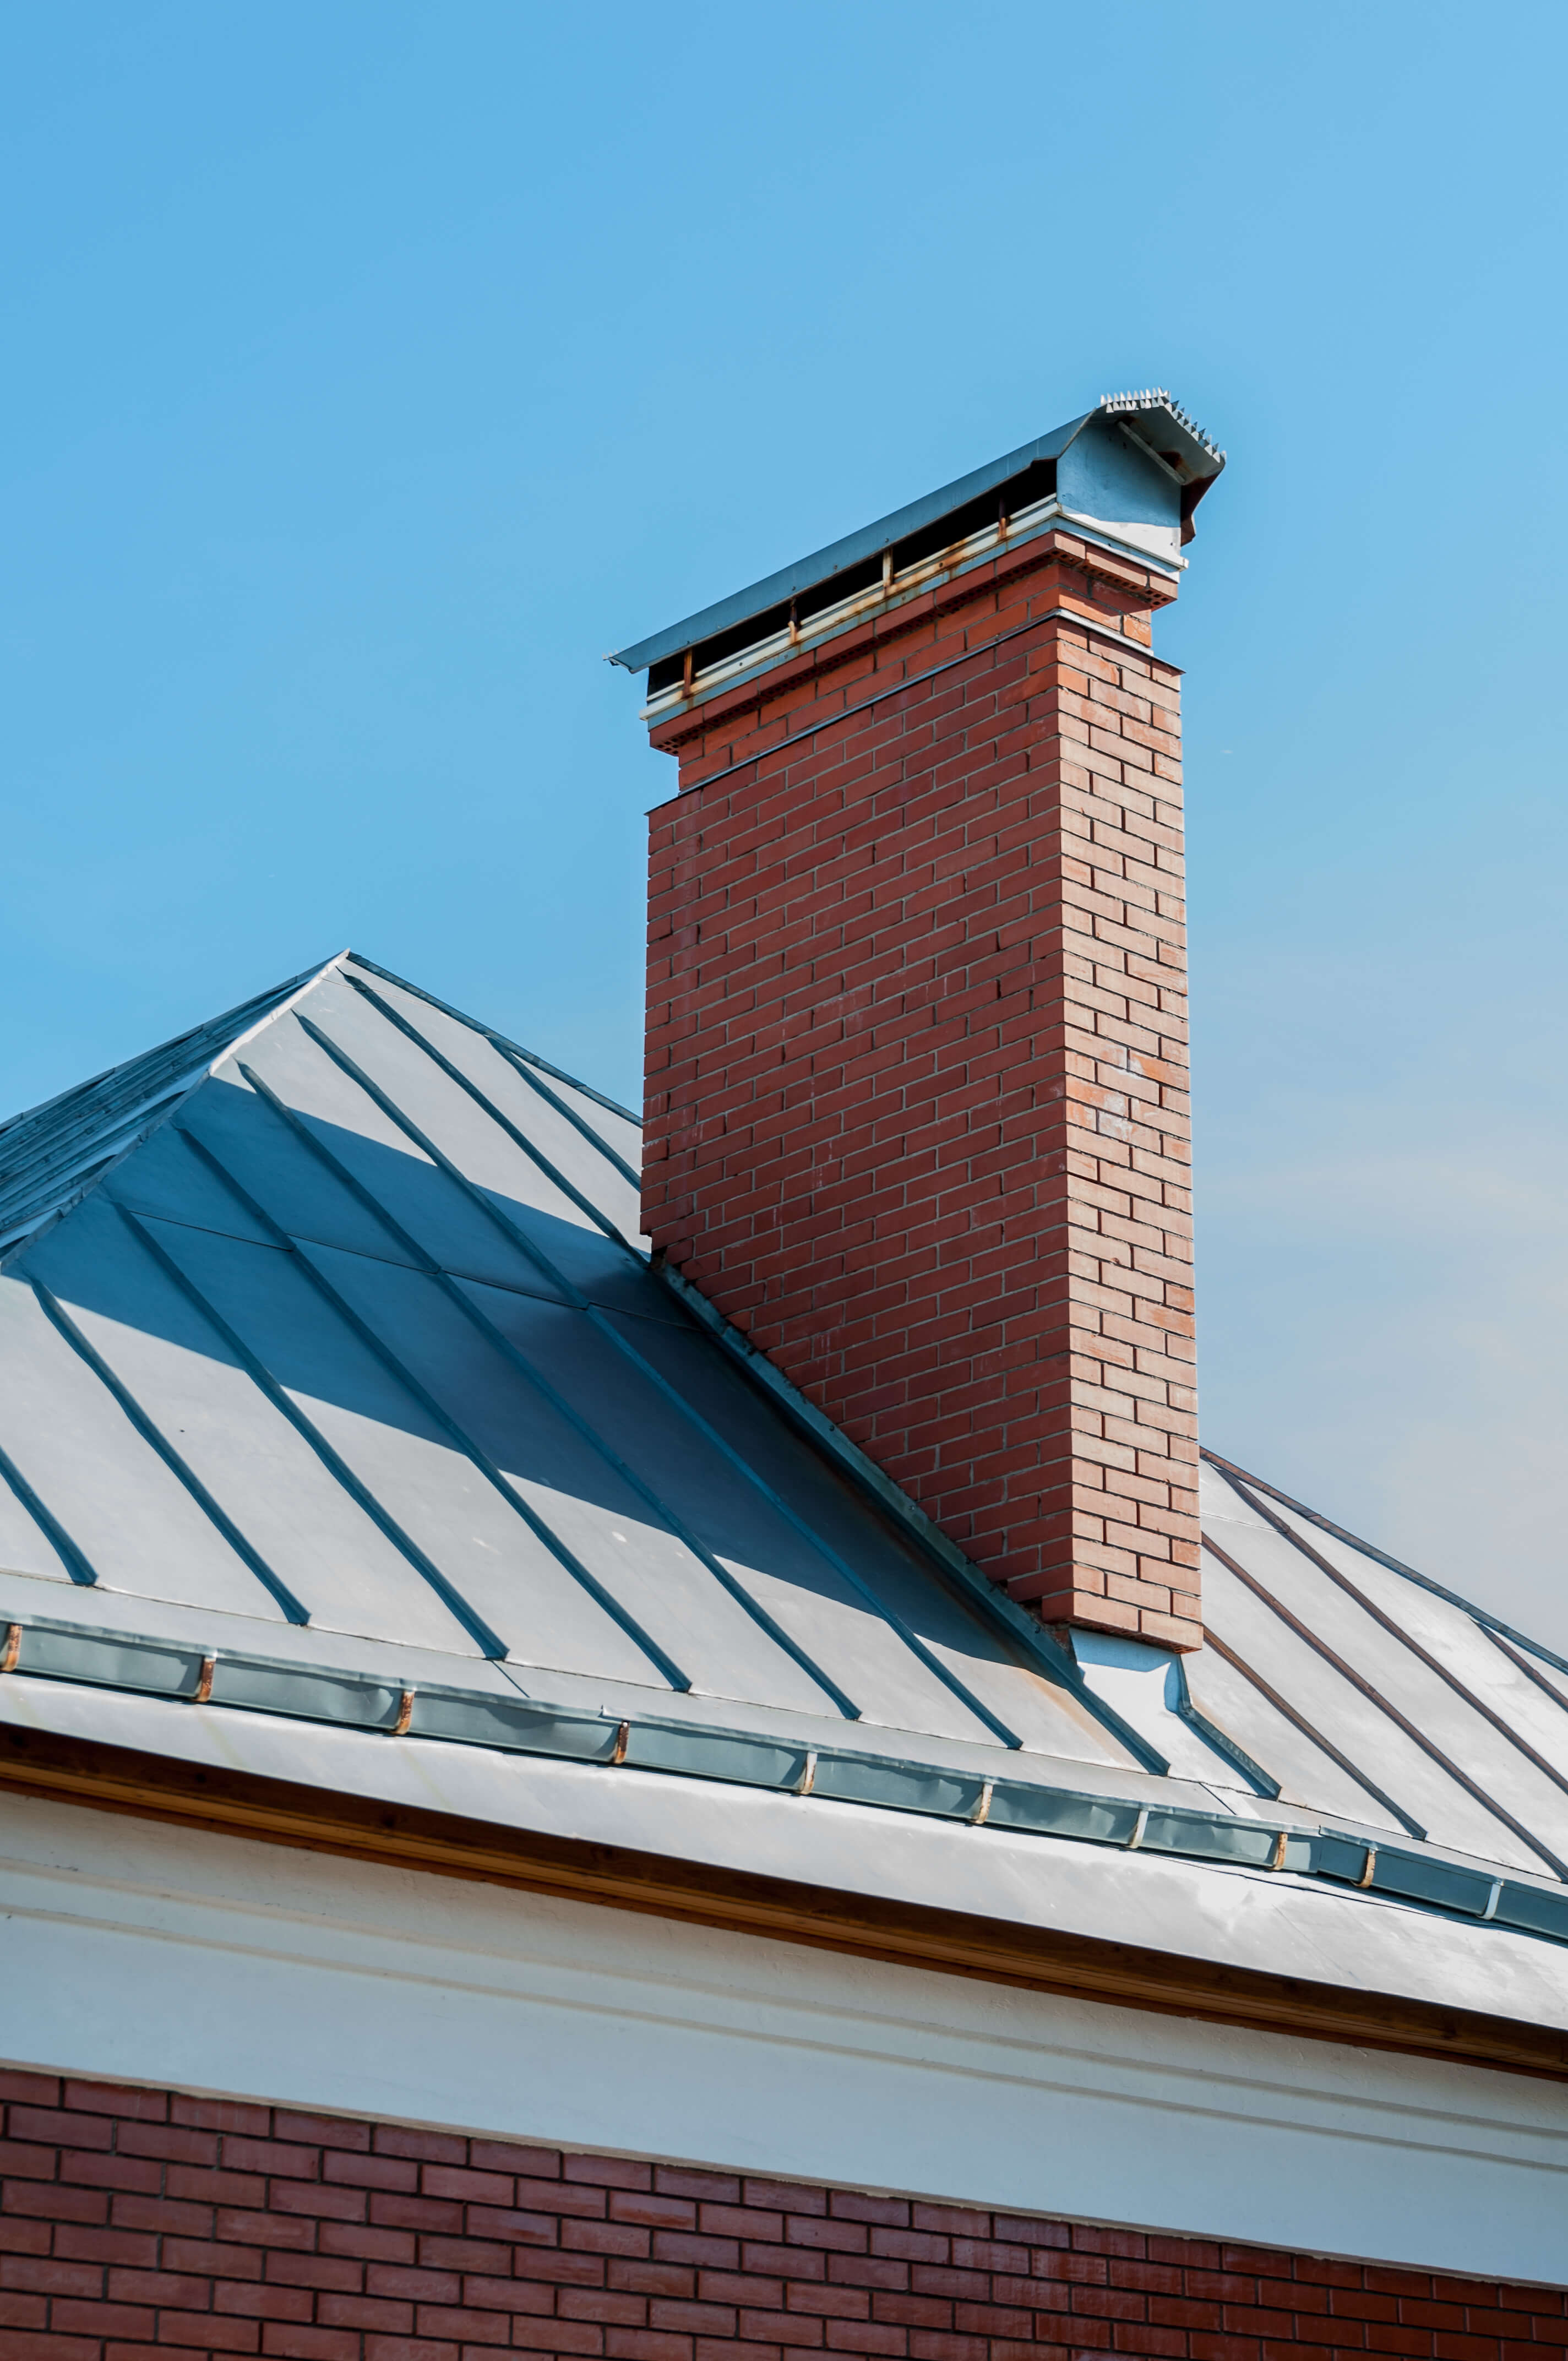
Stripping your existing rectangular hip roof down to bare wood sheathing and installing either steel or aluminum shingles.
$0
$0
0%
Adding a 100-square-foot bathroom with a high-end soaking tub, shower, stone double vanity, separate commode area, and in-floor heating. This addition will add some square footage to your floor plan and can be a luxurious addition to your home.
$0
$0
0%
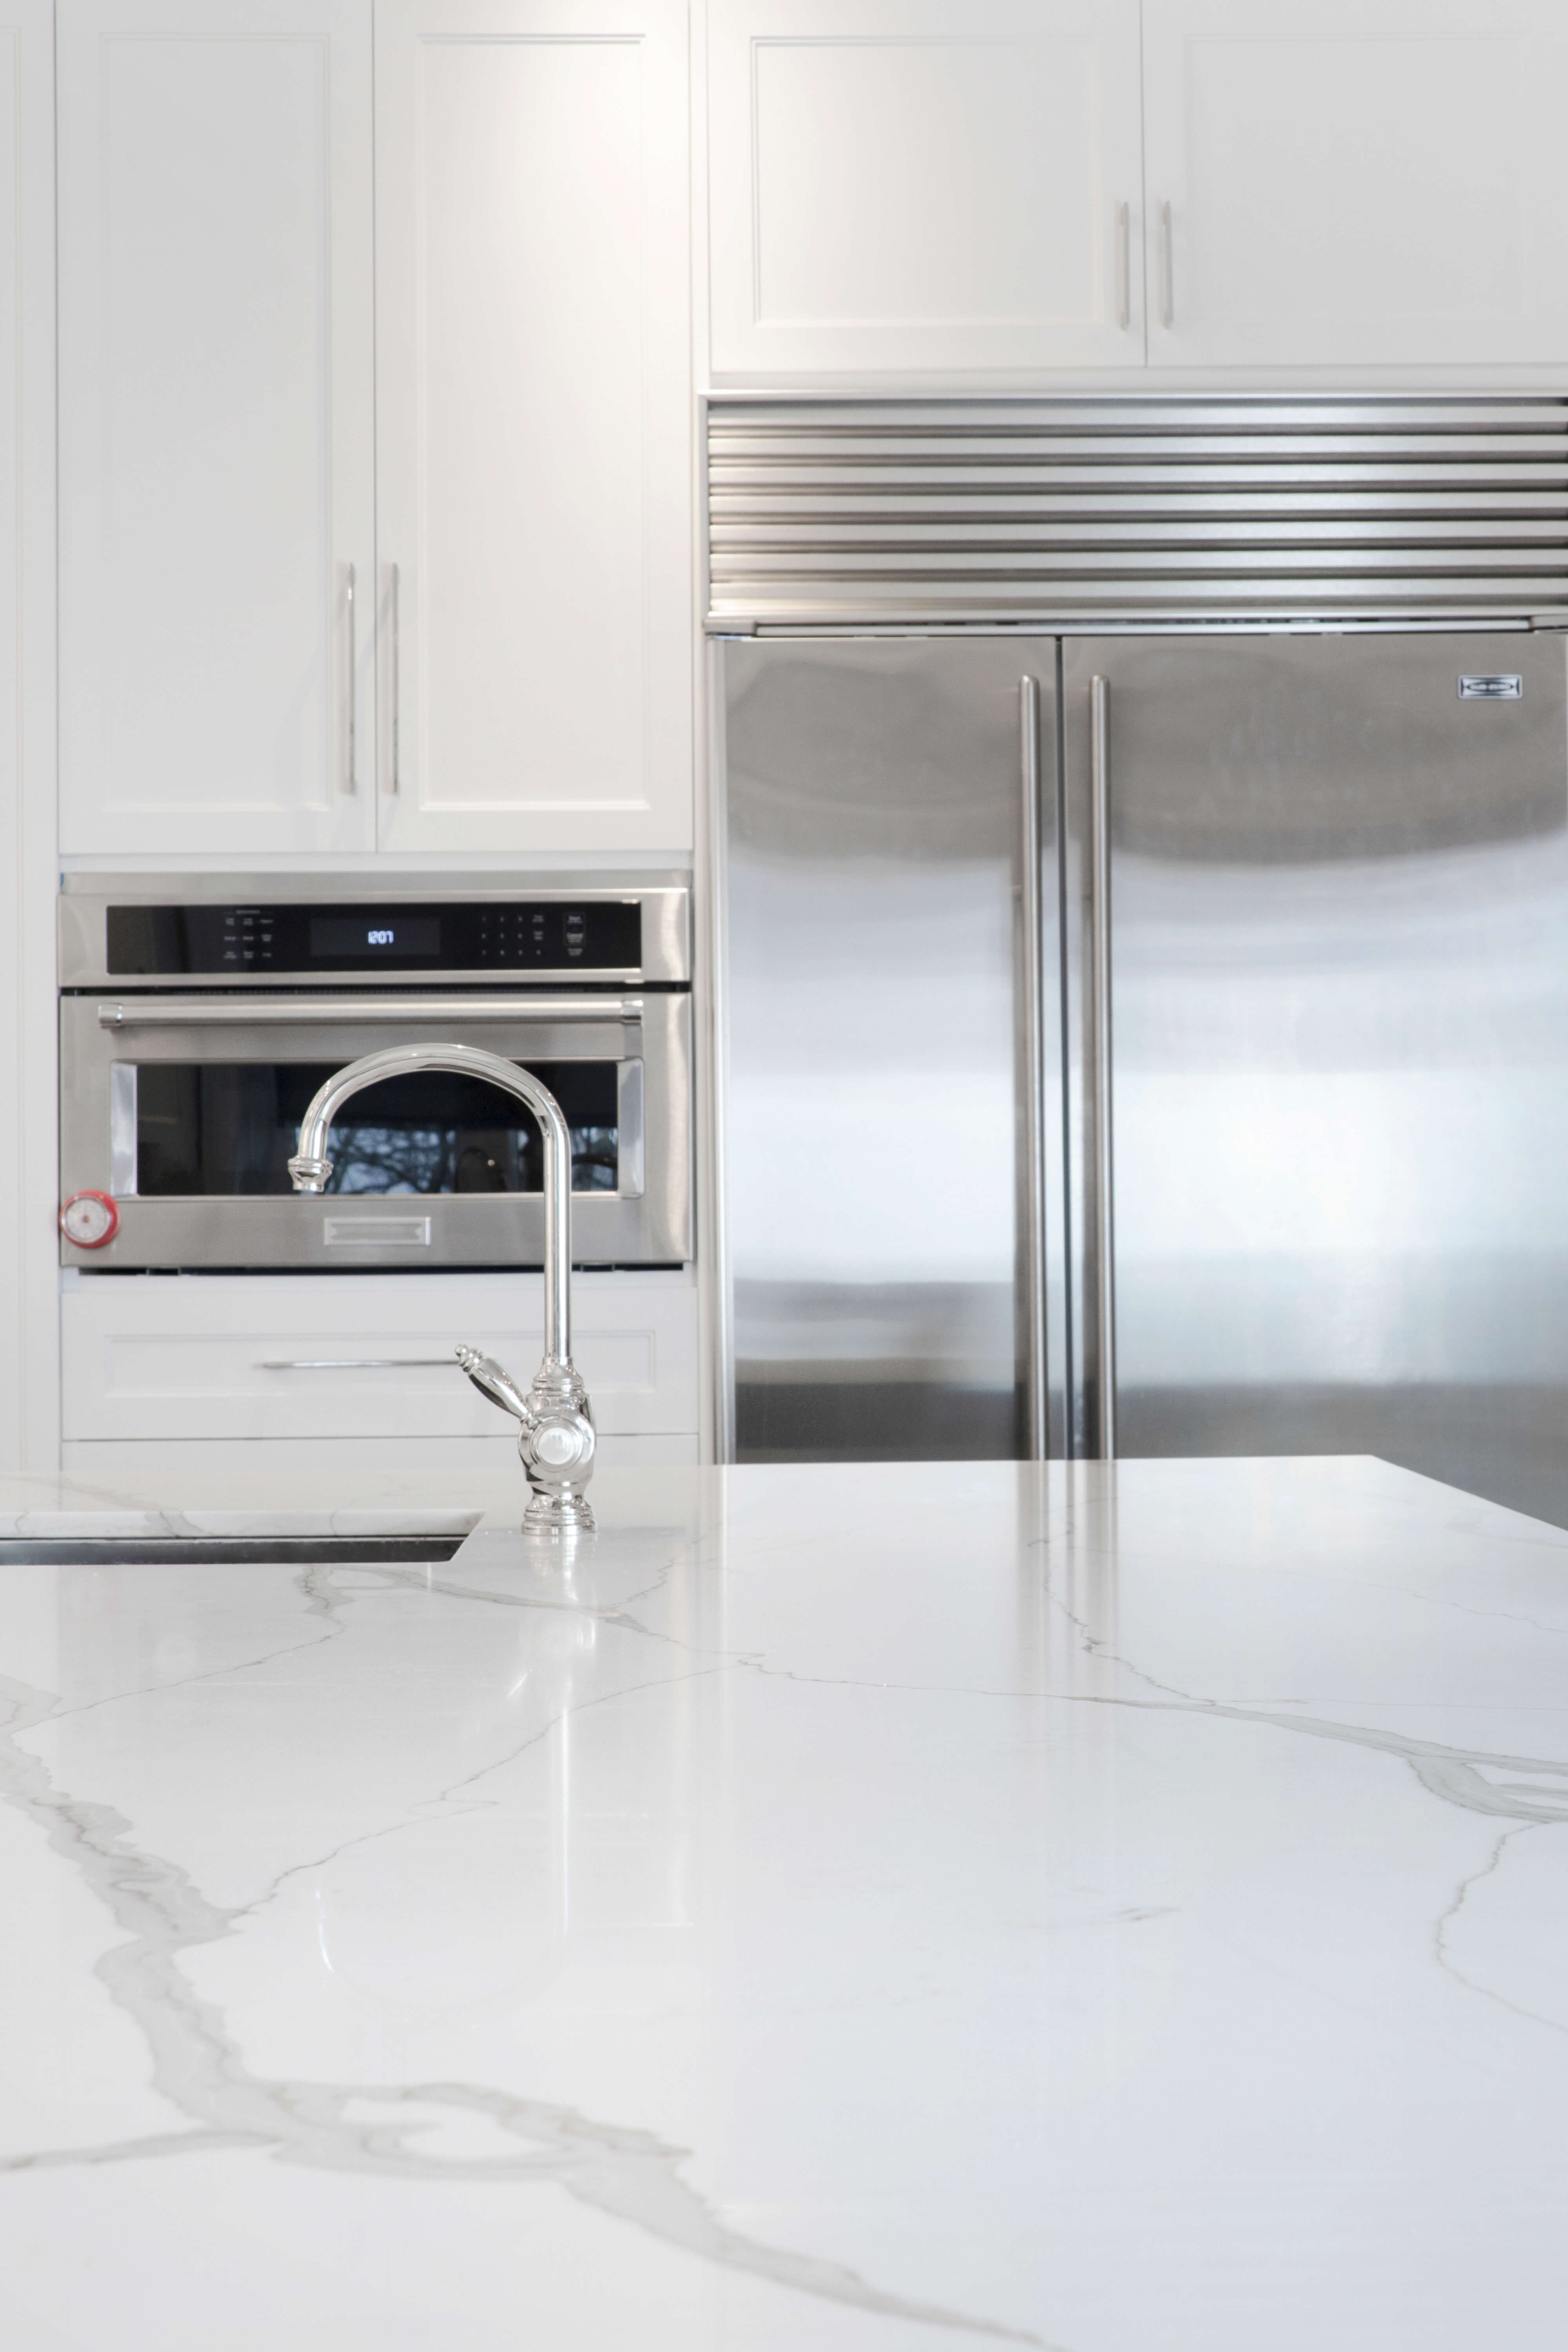
Removing existing countertops and installing 96 square feet of quartz countertops that are cut to your kitchen’s shape and size.
$0
$0
0%
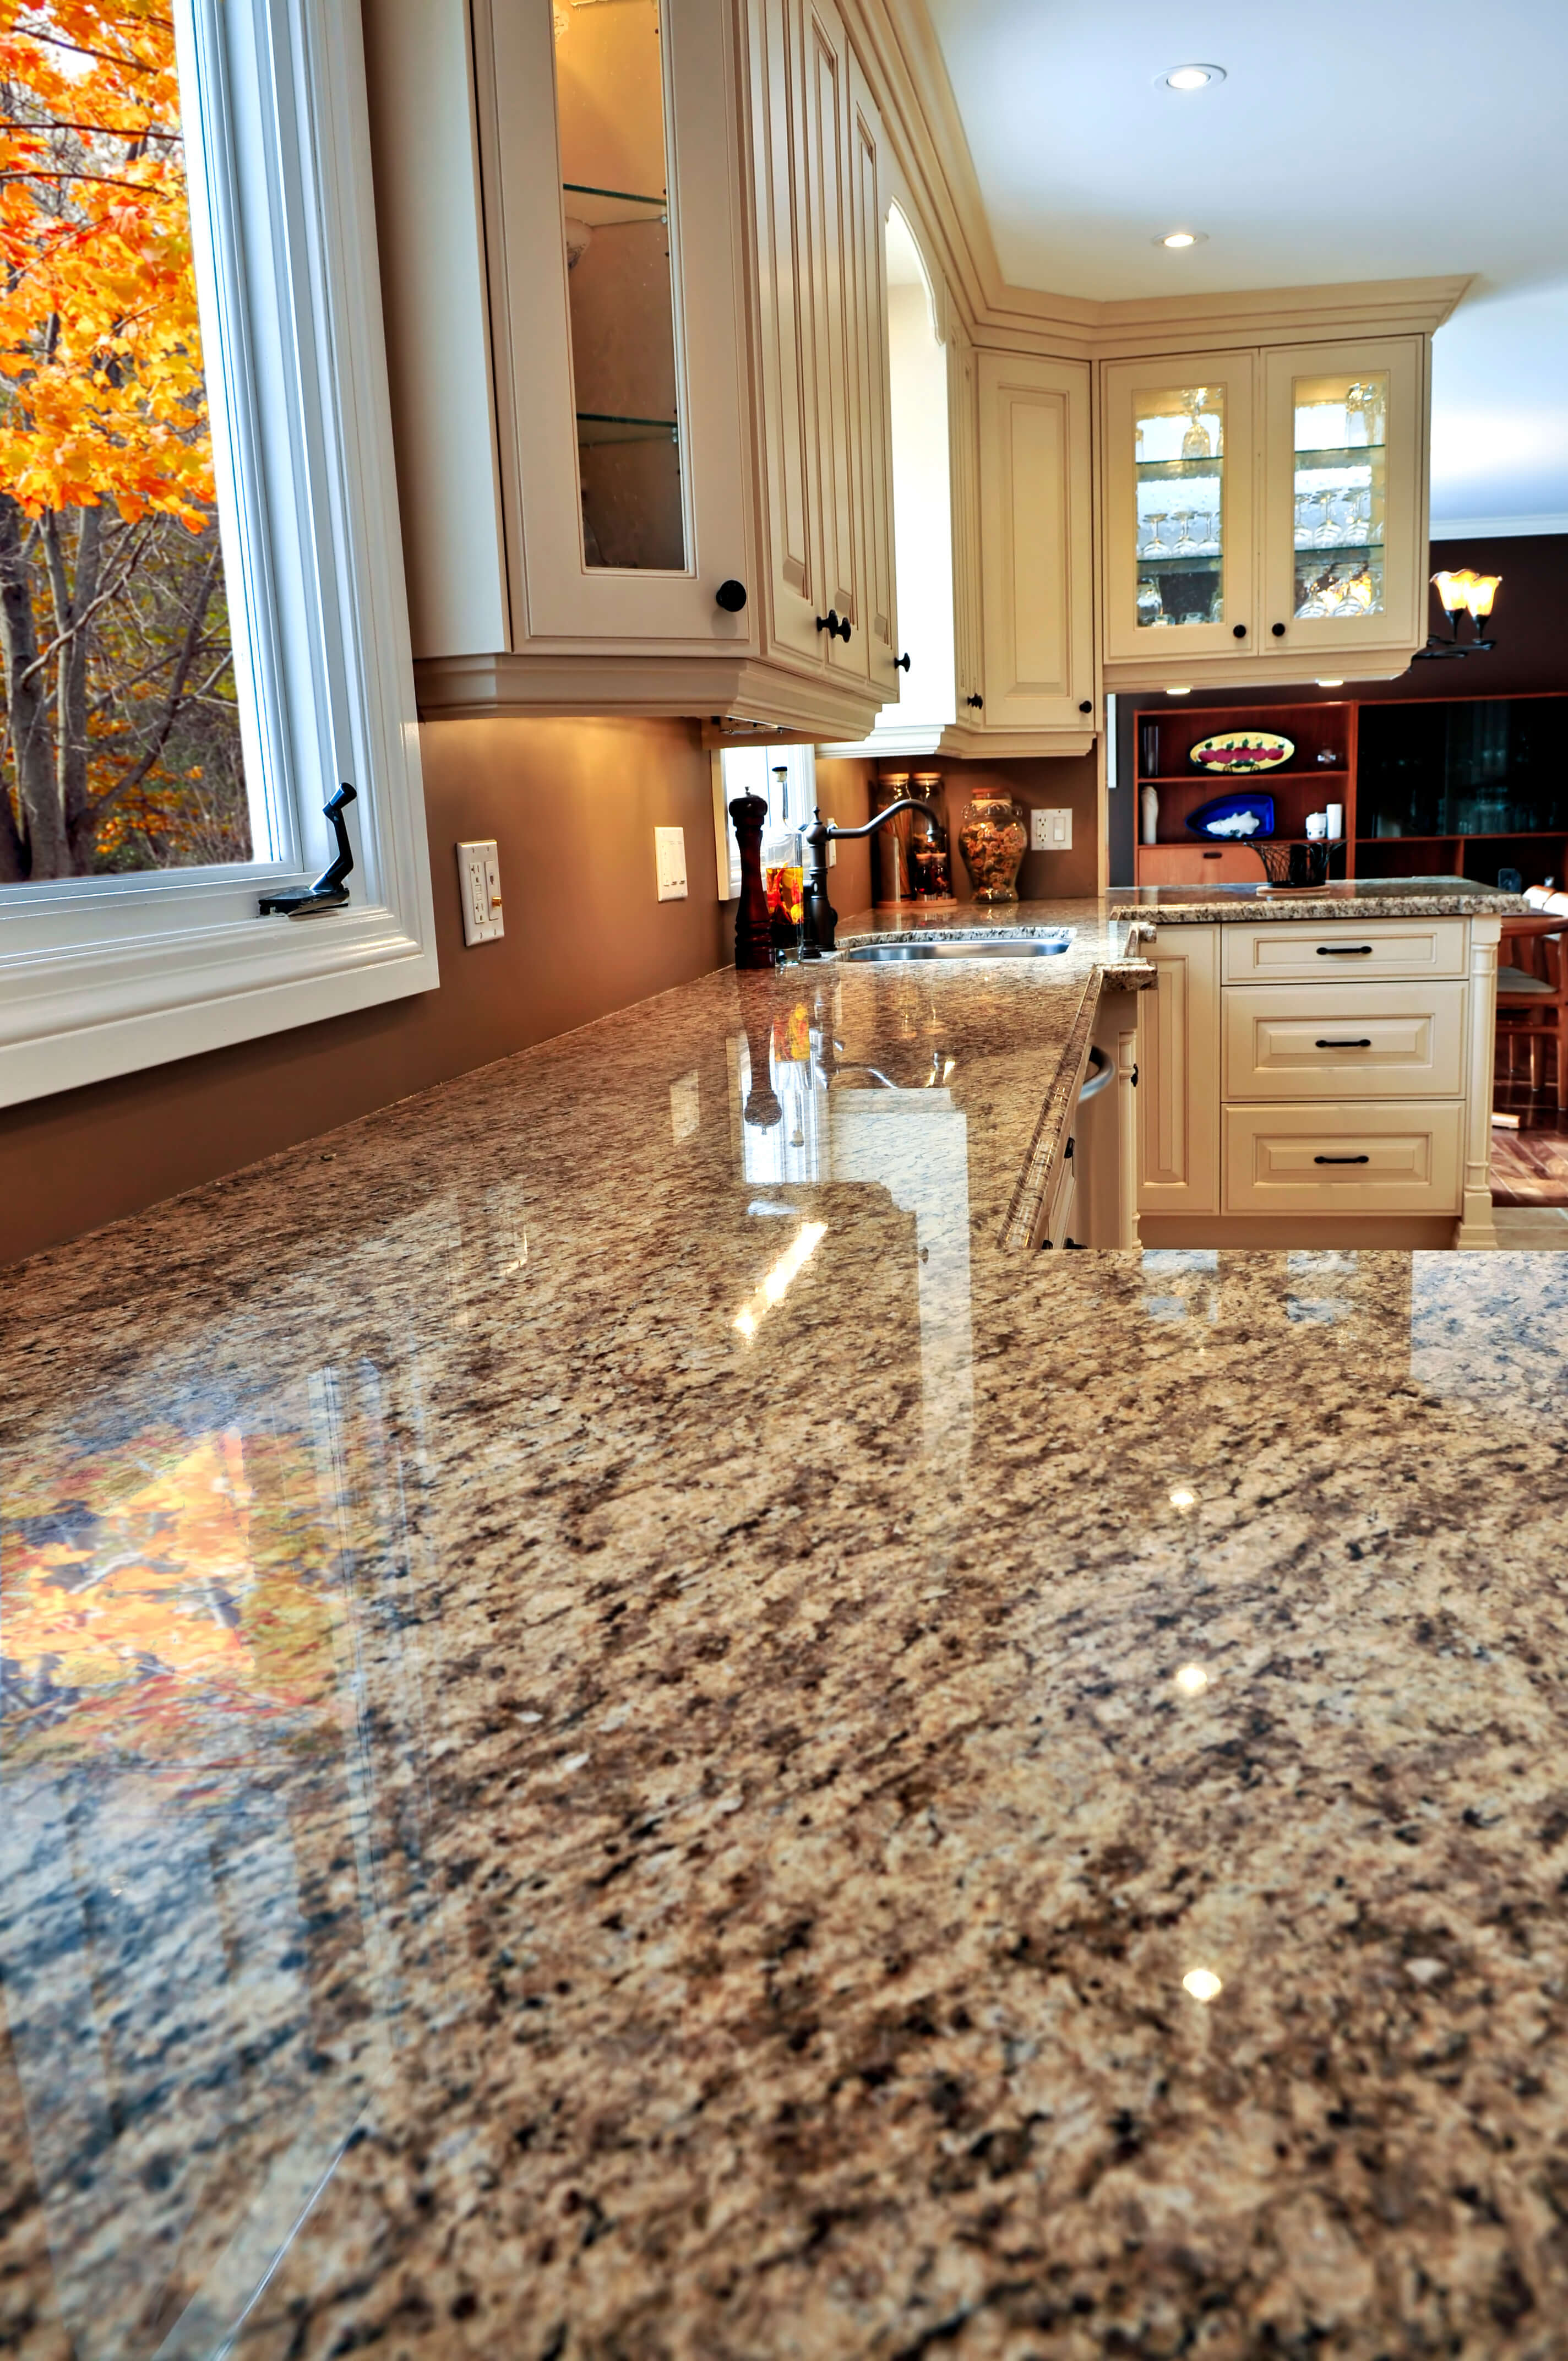
Removing and replacing 96 square feet of kitchen countertop space with new granite countertops.
$0
$0
0%
Building a 576-square-foot attached two-car garage with an epoxy floor, electronic garage door with windows, and doors to the home and outside.
$0
$0
0%
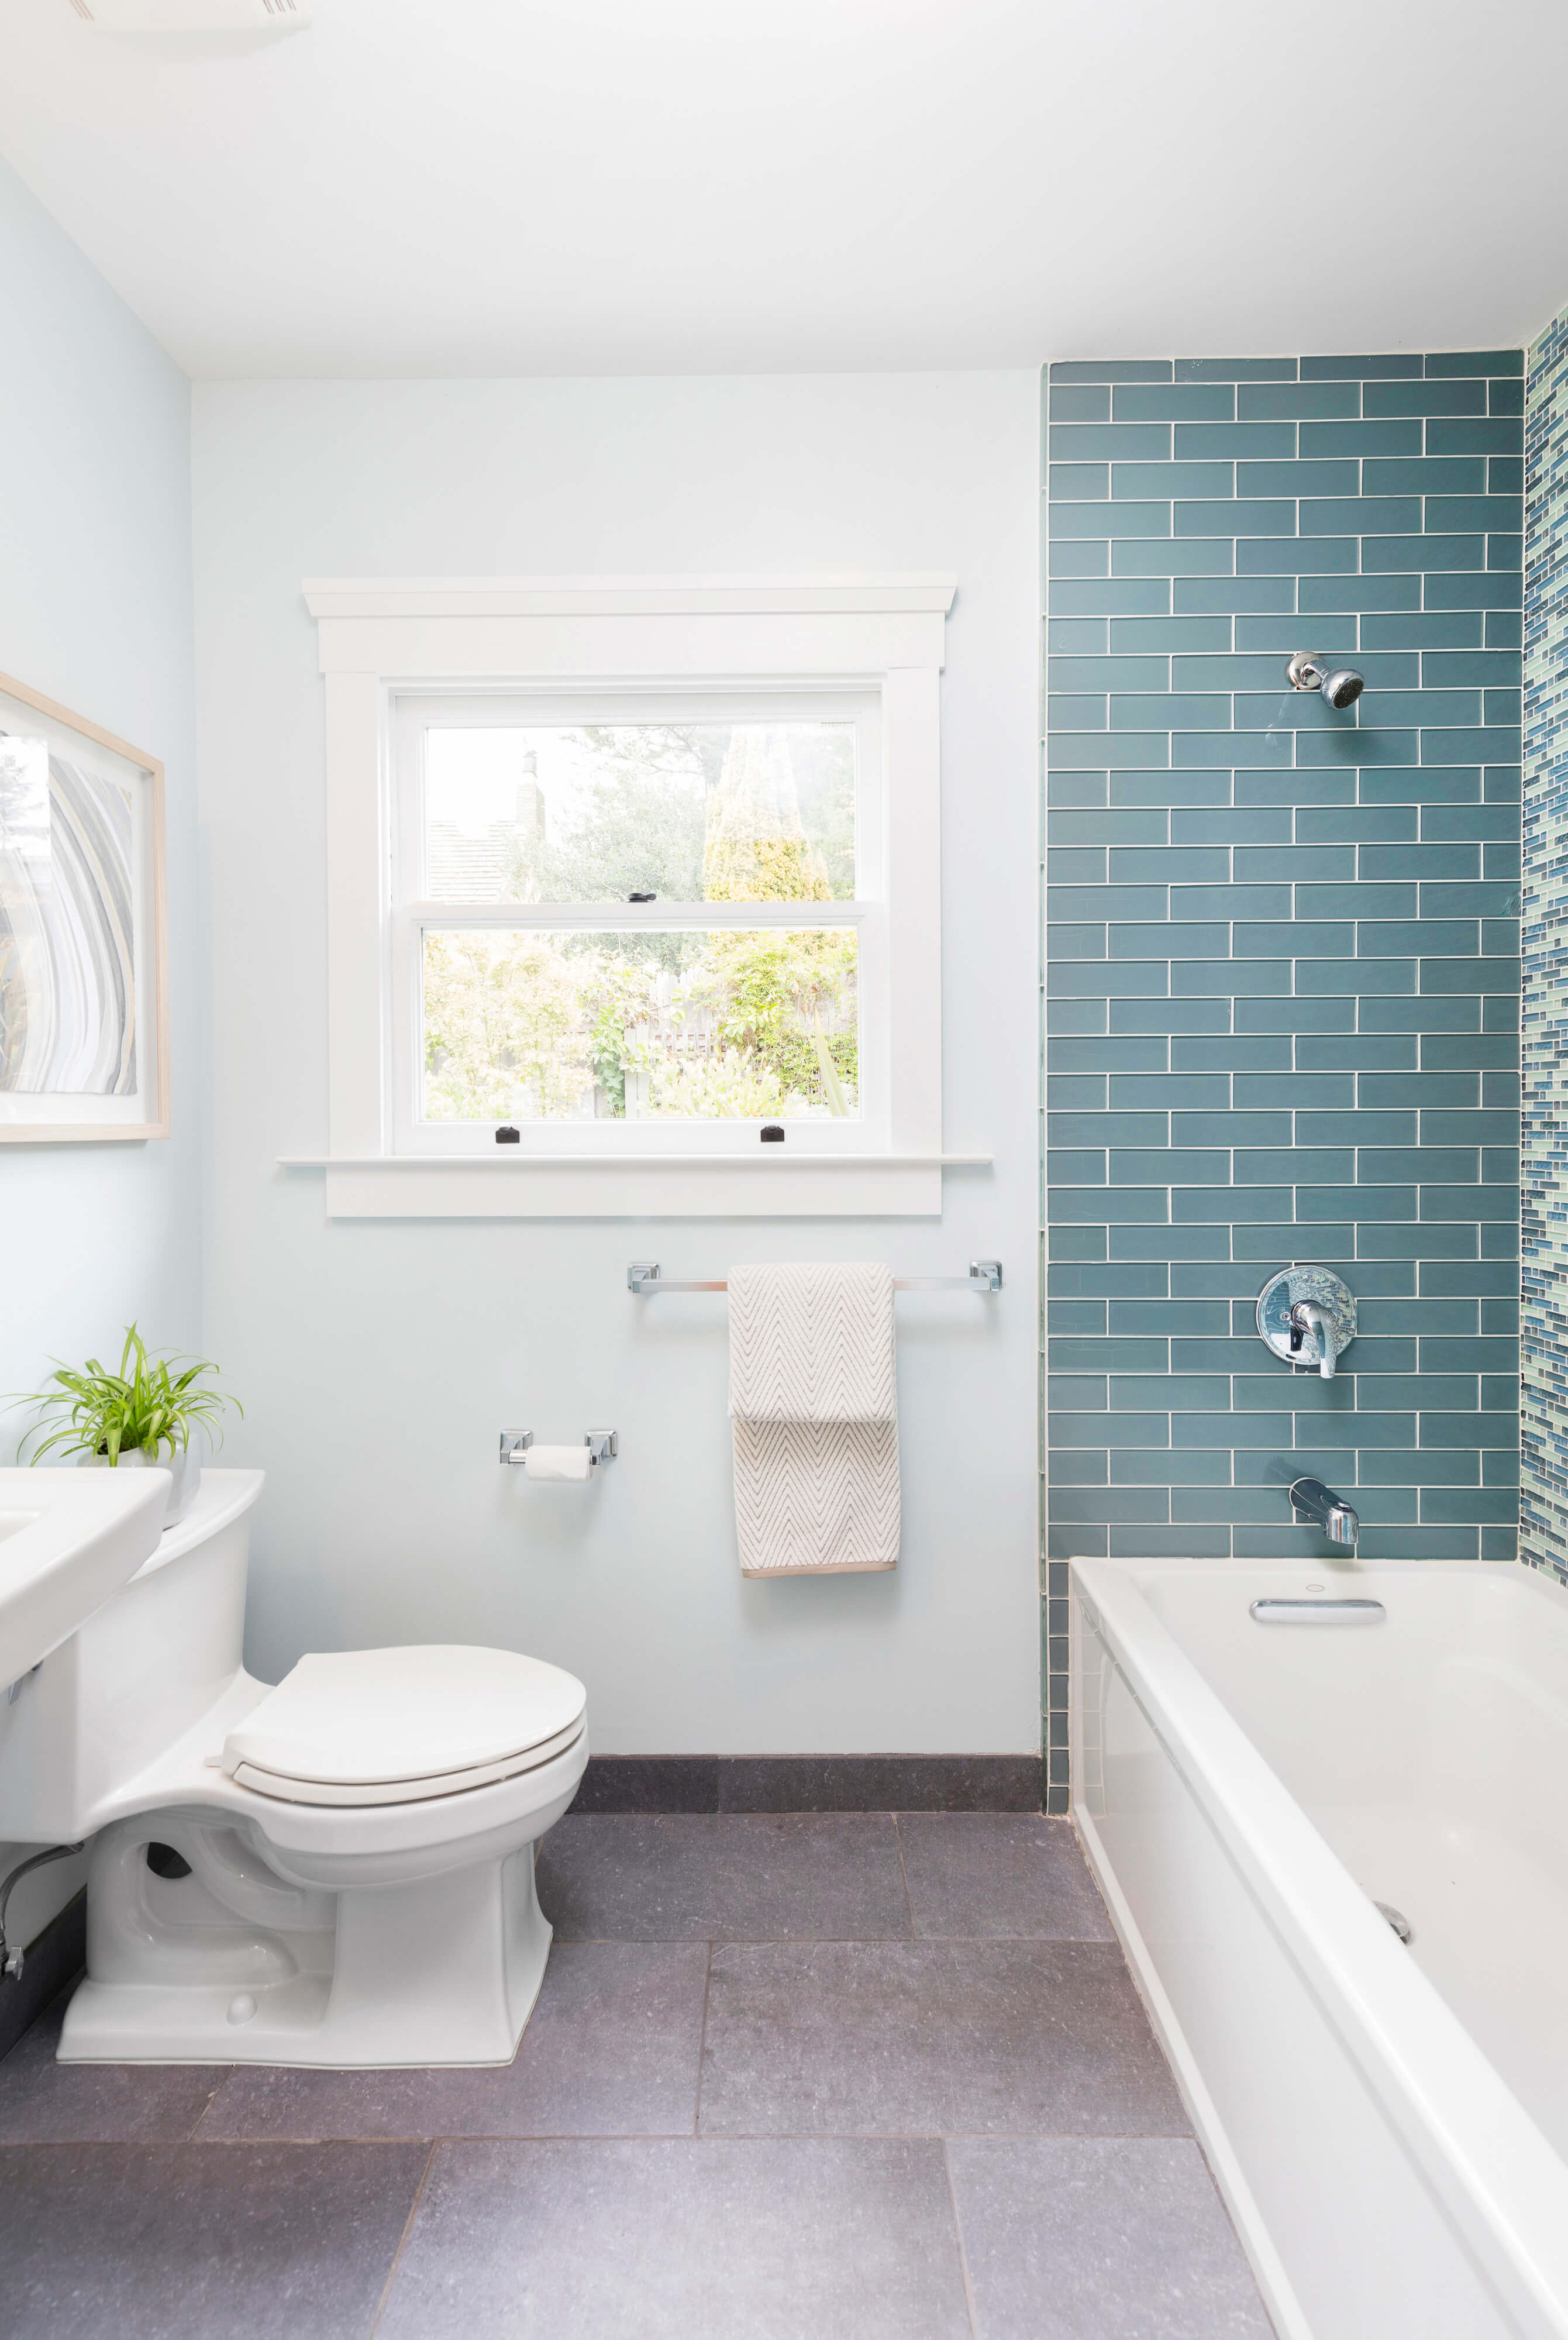
Updating a 35-square-foot bathroom with a new tub, toilet, vanity, lighted medicine cabinet, tile flooring, and vinyl wallpaper.
$0
$0
0%
Updating your exterior with 300 square feet of manufactured stone in the front of the home.
$0
$0
0%
Building a 32-square-foot full bathroom with a new vanity, toilet, tub/shower, mirrored medicine cabinet, linen closet, tile floor, and fixtures.
$0
$0
0%
Updating a 200-square-foot kitchen with new cabinets, laminate countertops, and a more energy-efficient range and oven.
$0
$0
0%
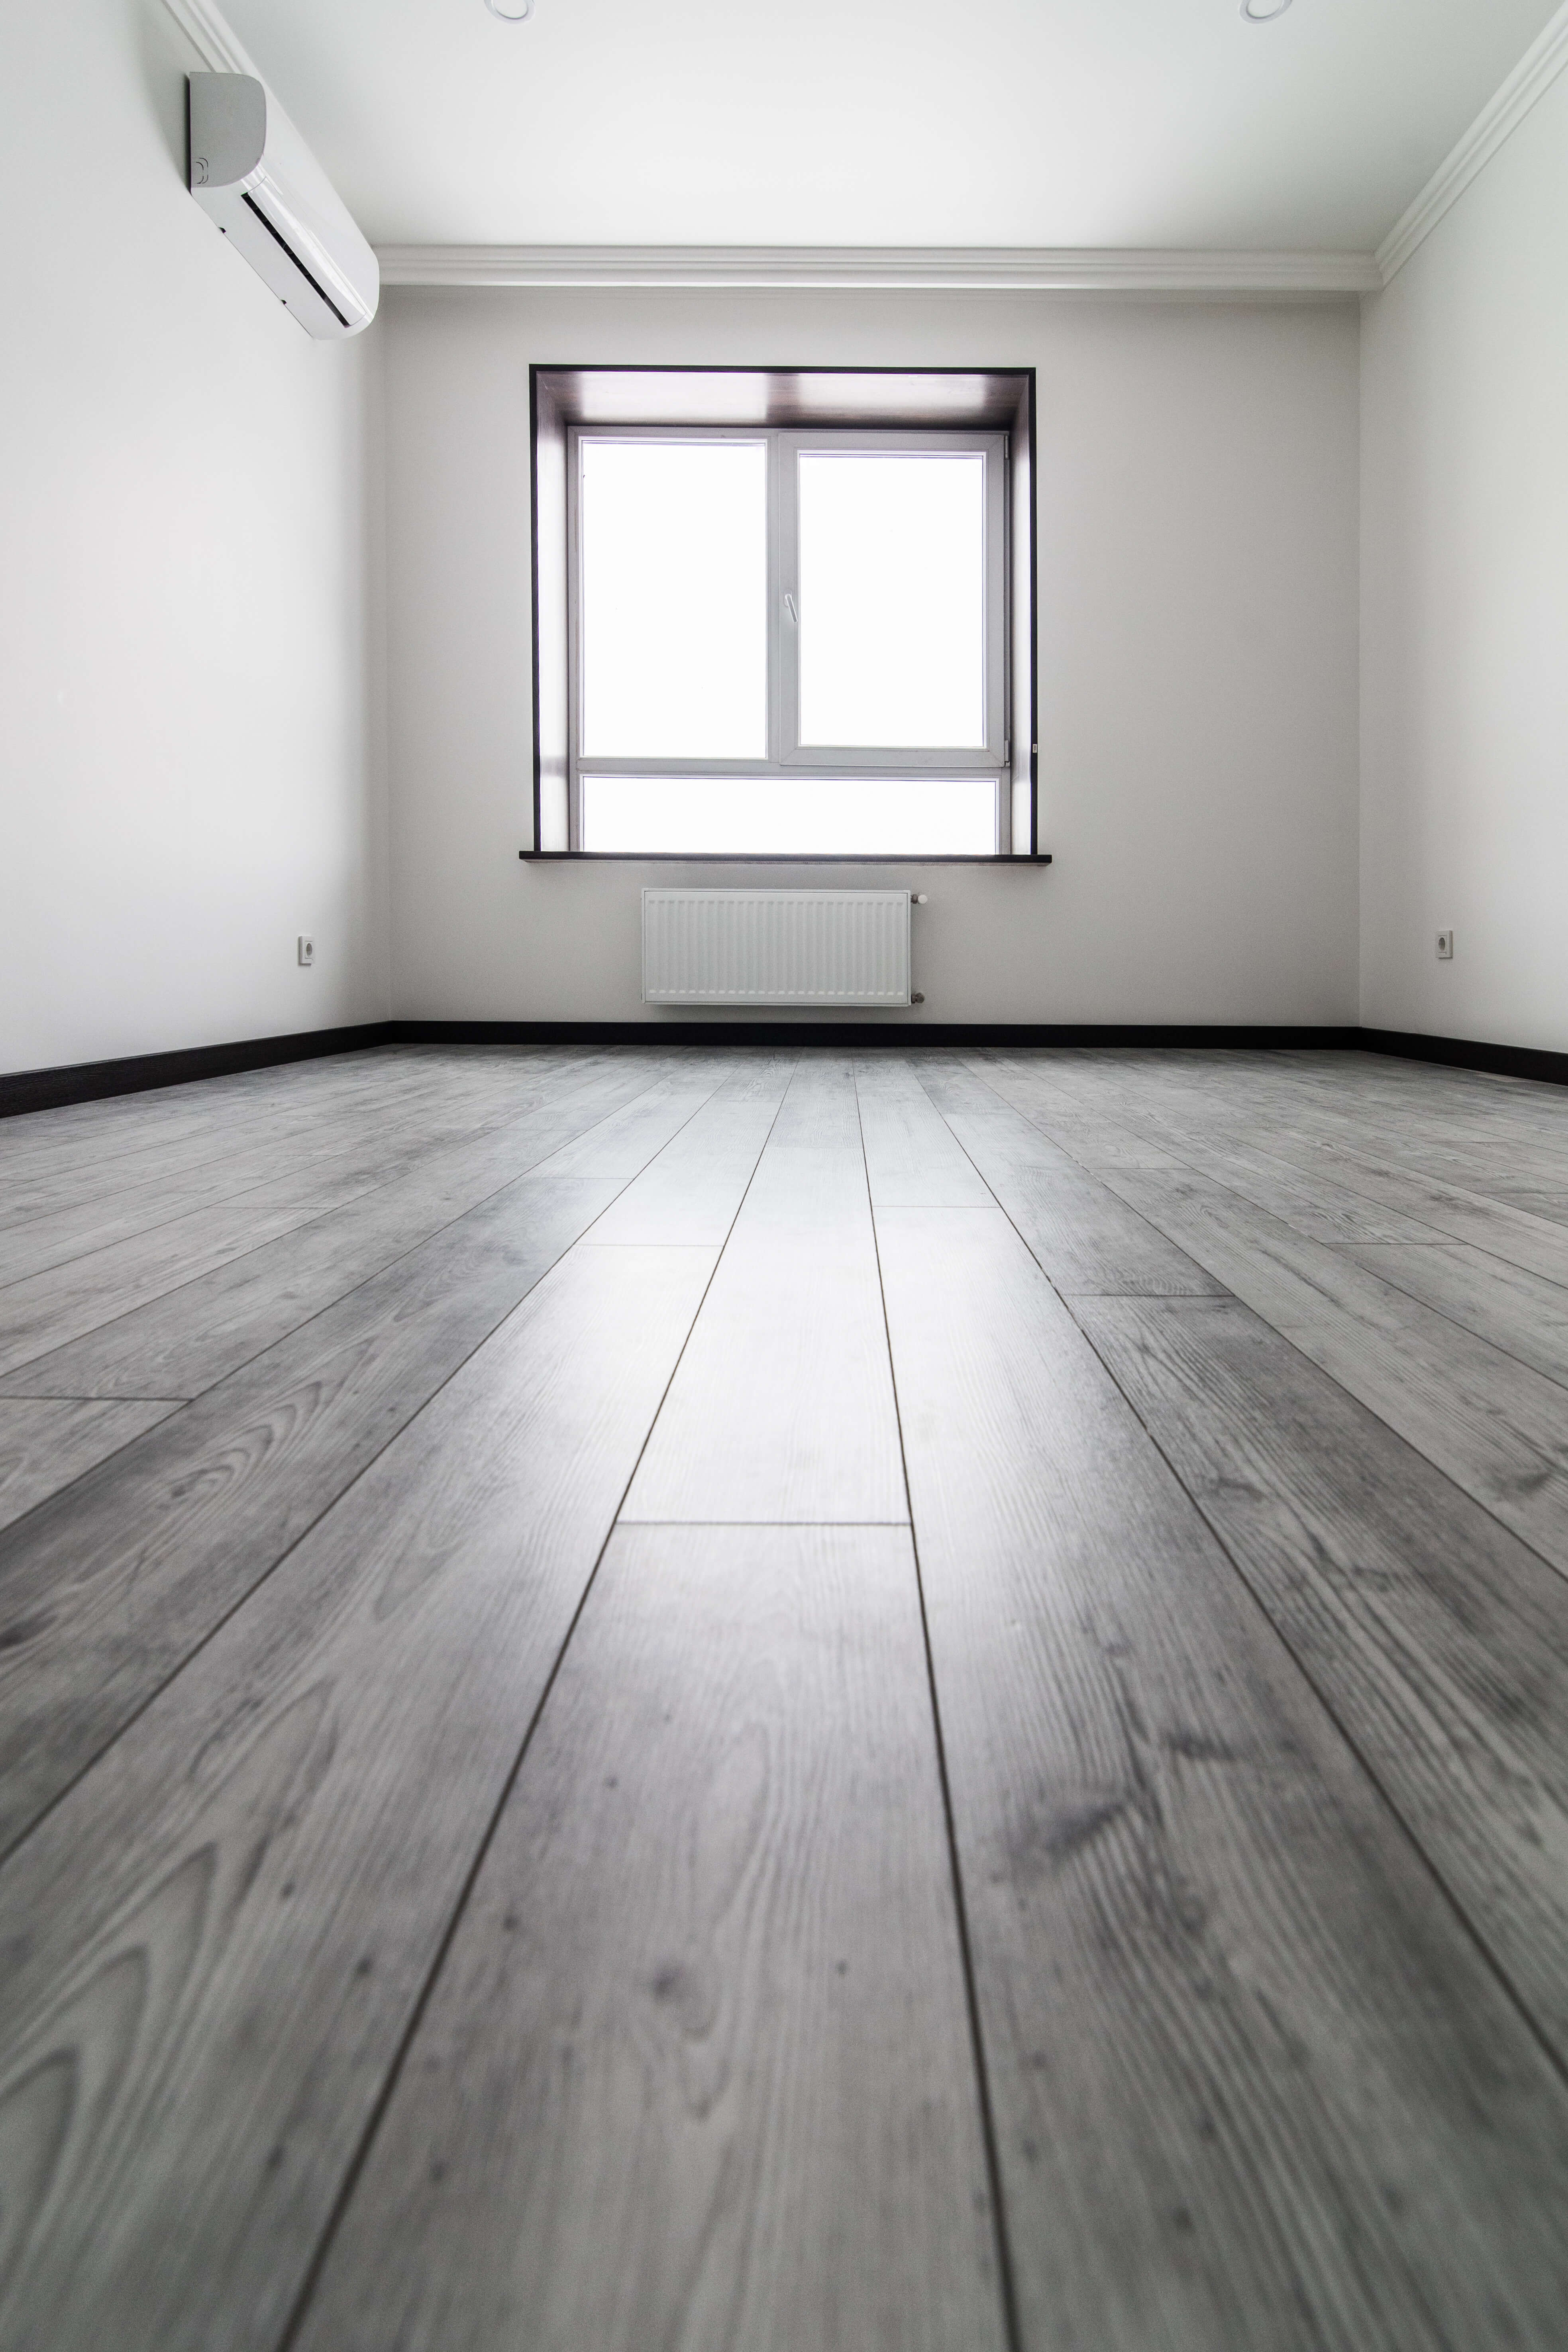
Removing 200 square feet of flooring and replacing it with new laminate flooring.
$0
$0
0%
Building floors, walls, a ceiling, and a roof on top of an existing garage, as well as a staircase from the garage to the new addition.
$0
$0
0%
Updating a 200-square-foot kitchen with top-of-the-line appliances, cabinets, countertops, and flooring. This kind of remodel can make your kitchen a real focal point of your home.
$0
$0
0%
Updating a 200-square-foot kitchen with new cabinets, countertops, flooring, lighting, and new appliances.
$0
$0
0%
Building a luxurious 640-square-foot primary suite with a sitting area, fireplace, walk-in closet, dressing area, and a high-end full bathroom.
$0
$0
0%
Removing existing countertops and installing 96 square feet of laminate countertops that are cut to your kitchen’s shape and size.
$0
$0
0%
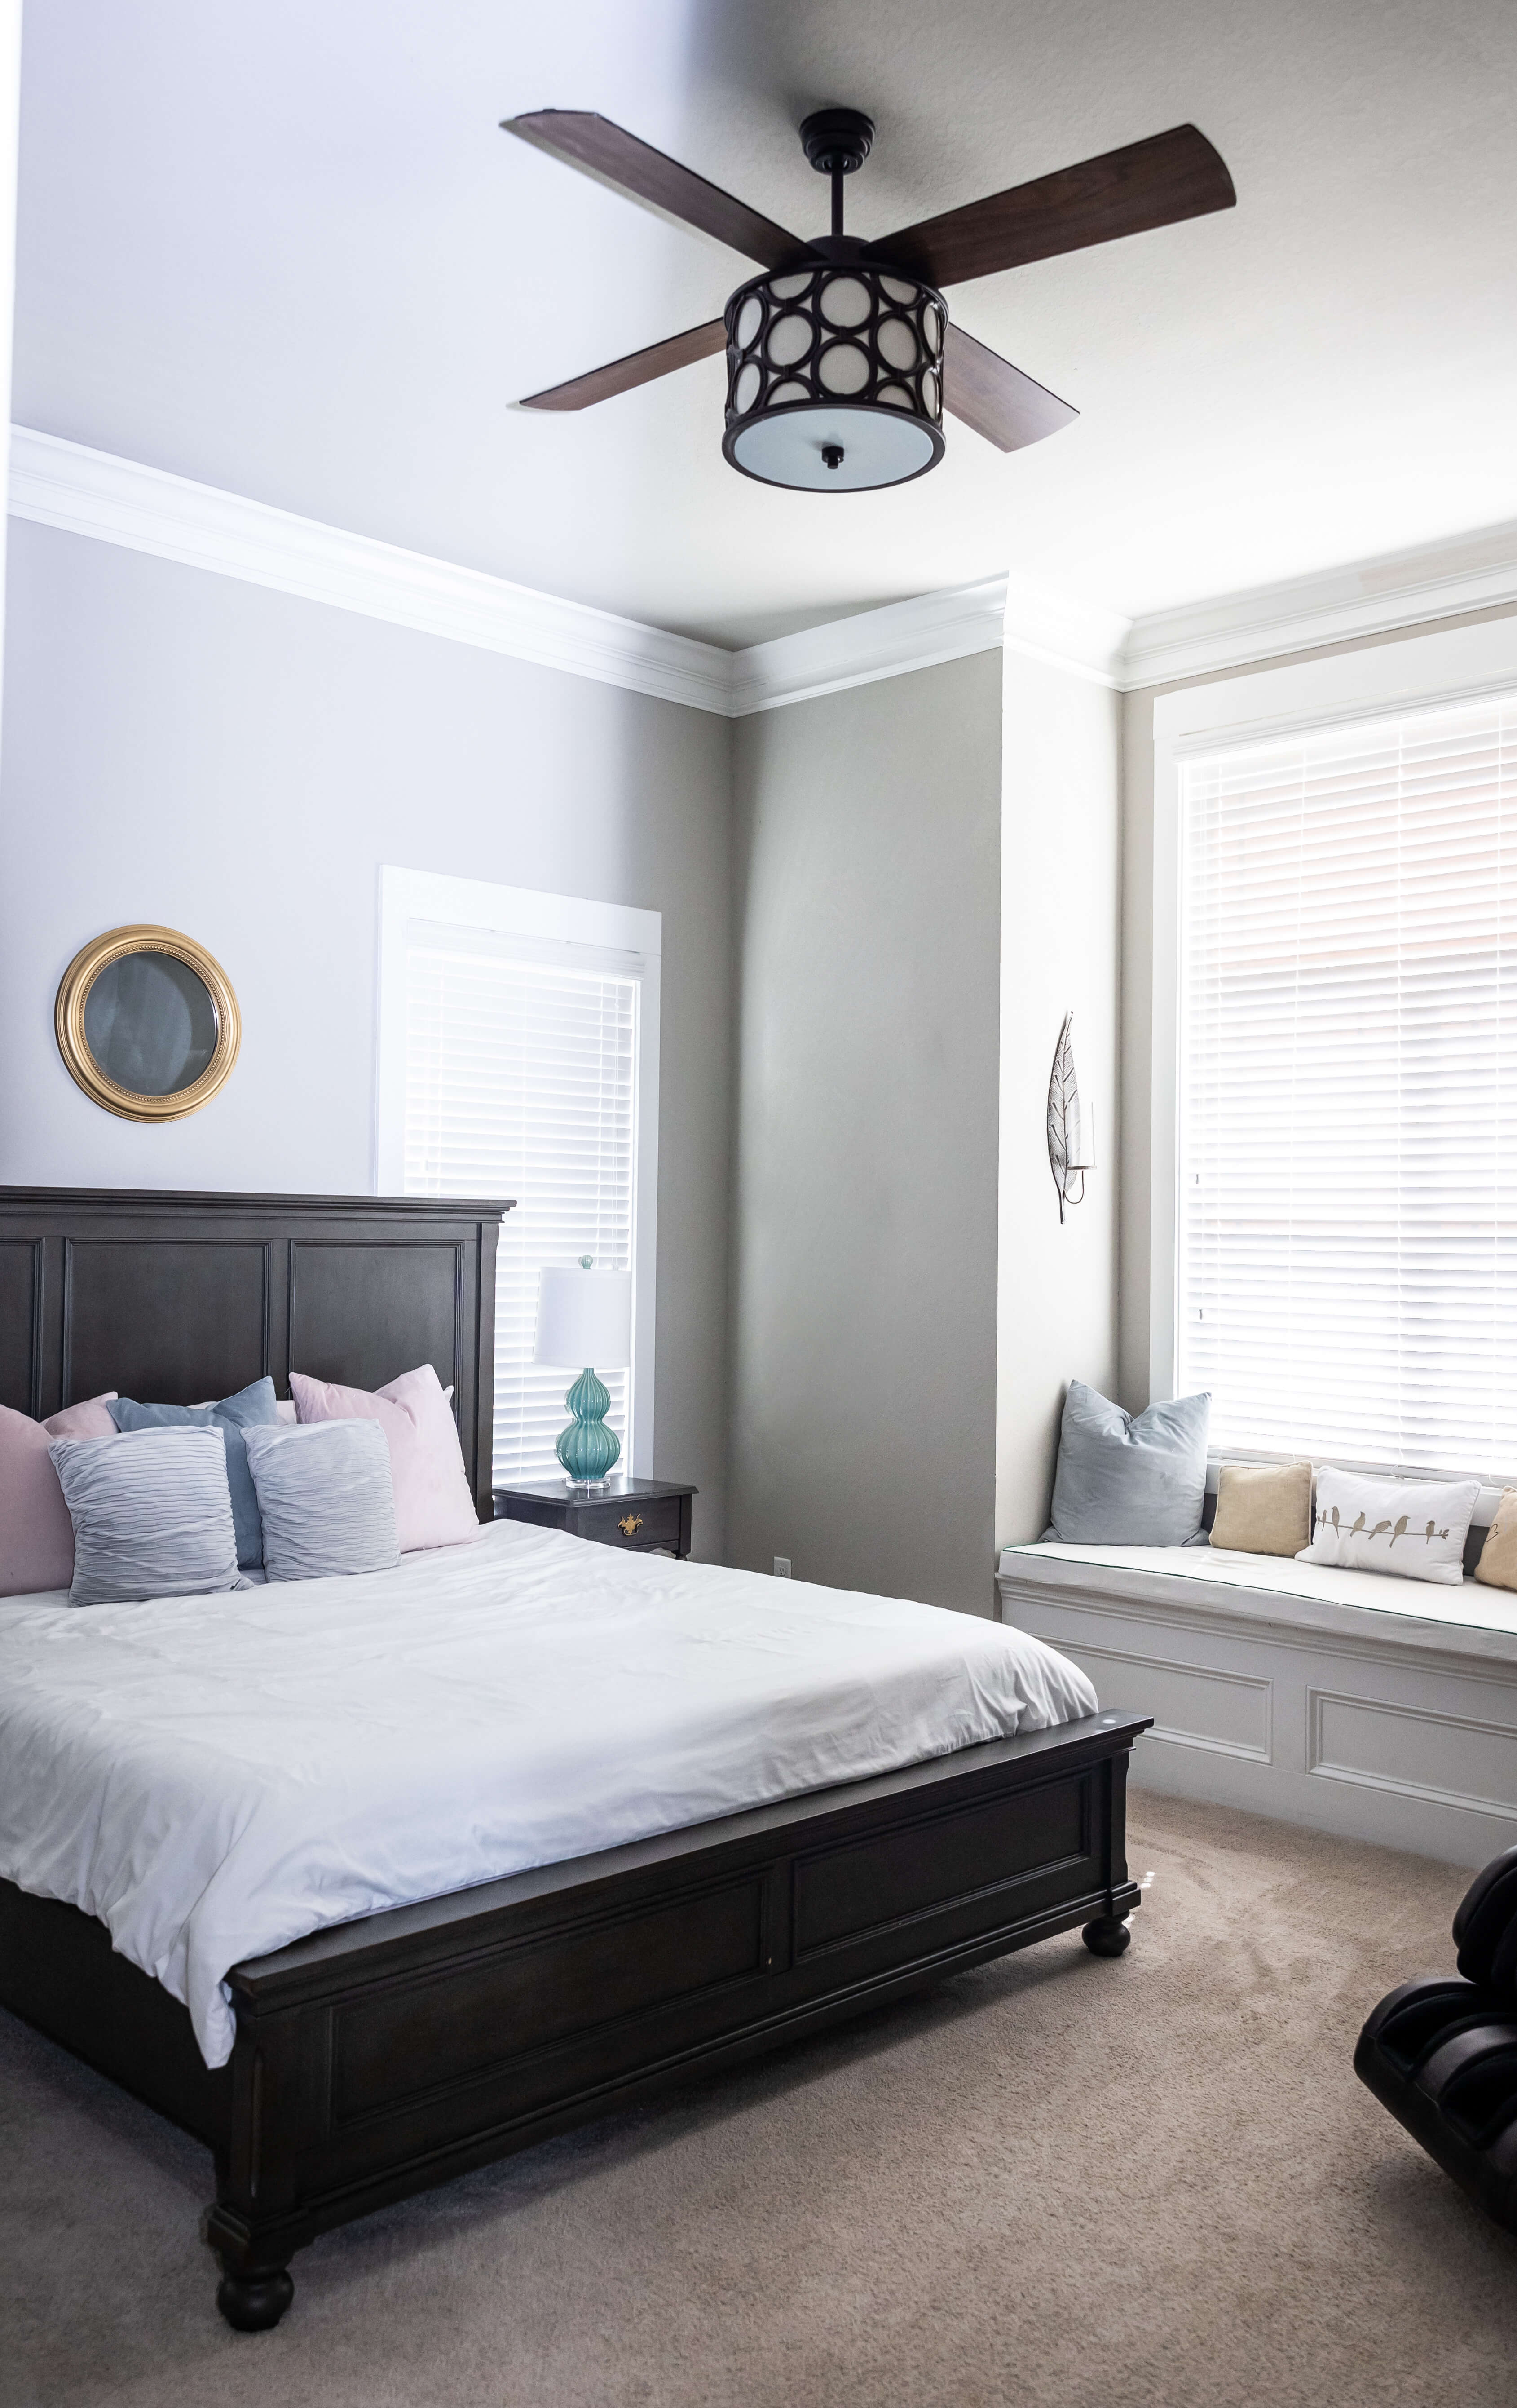
Building a 384-square-foot bedroom suite including a walk-in closet and dressing area, as well as a bathroom with a free-standing tub, shower, and double vanity.
$0
$0
0%
Project Scope: Expanding an existing bathroom from 35 square feet to 100 square feet, as well as making significant updates to all aspects of the bathroom.
$0
$0
0%
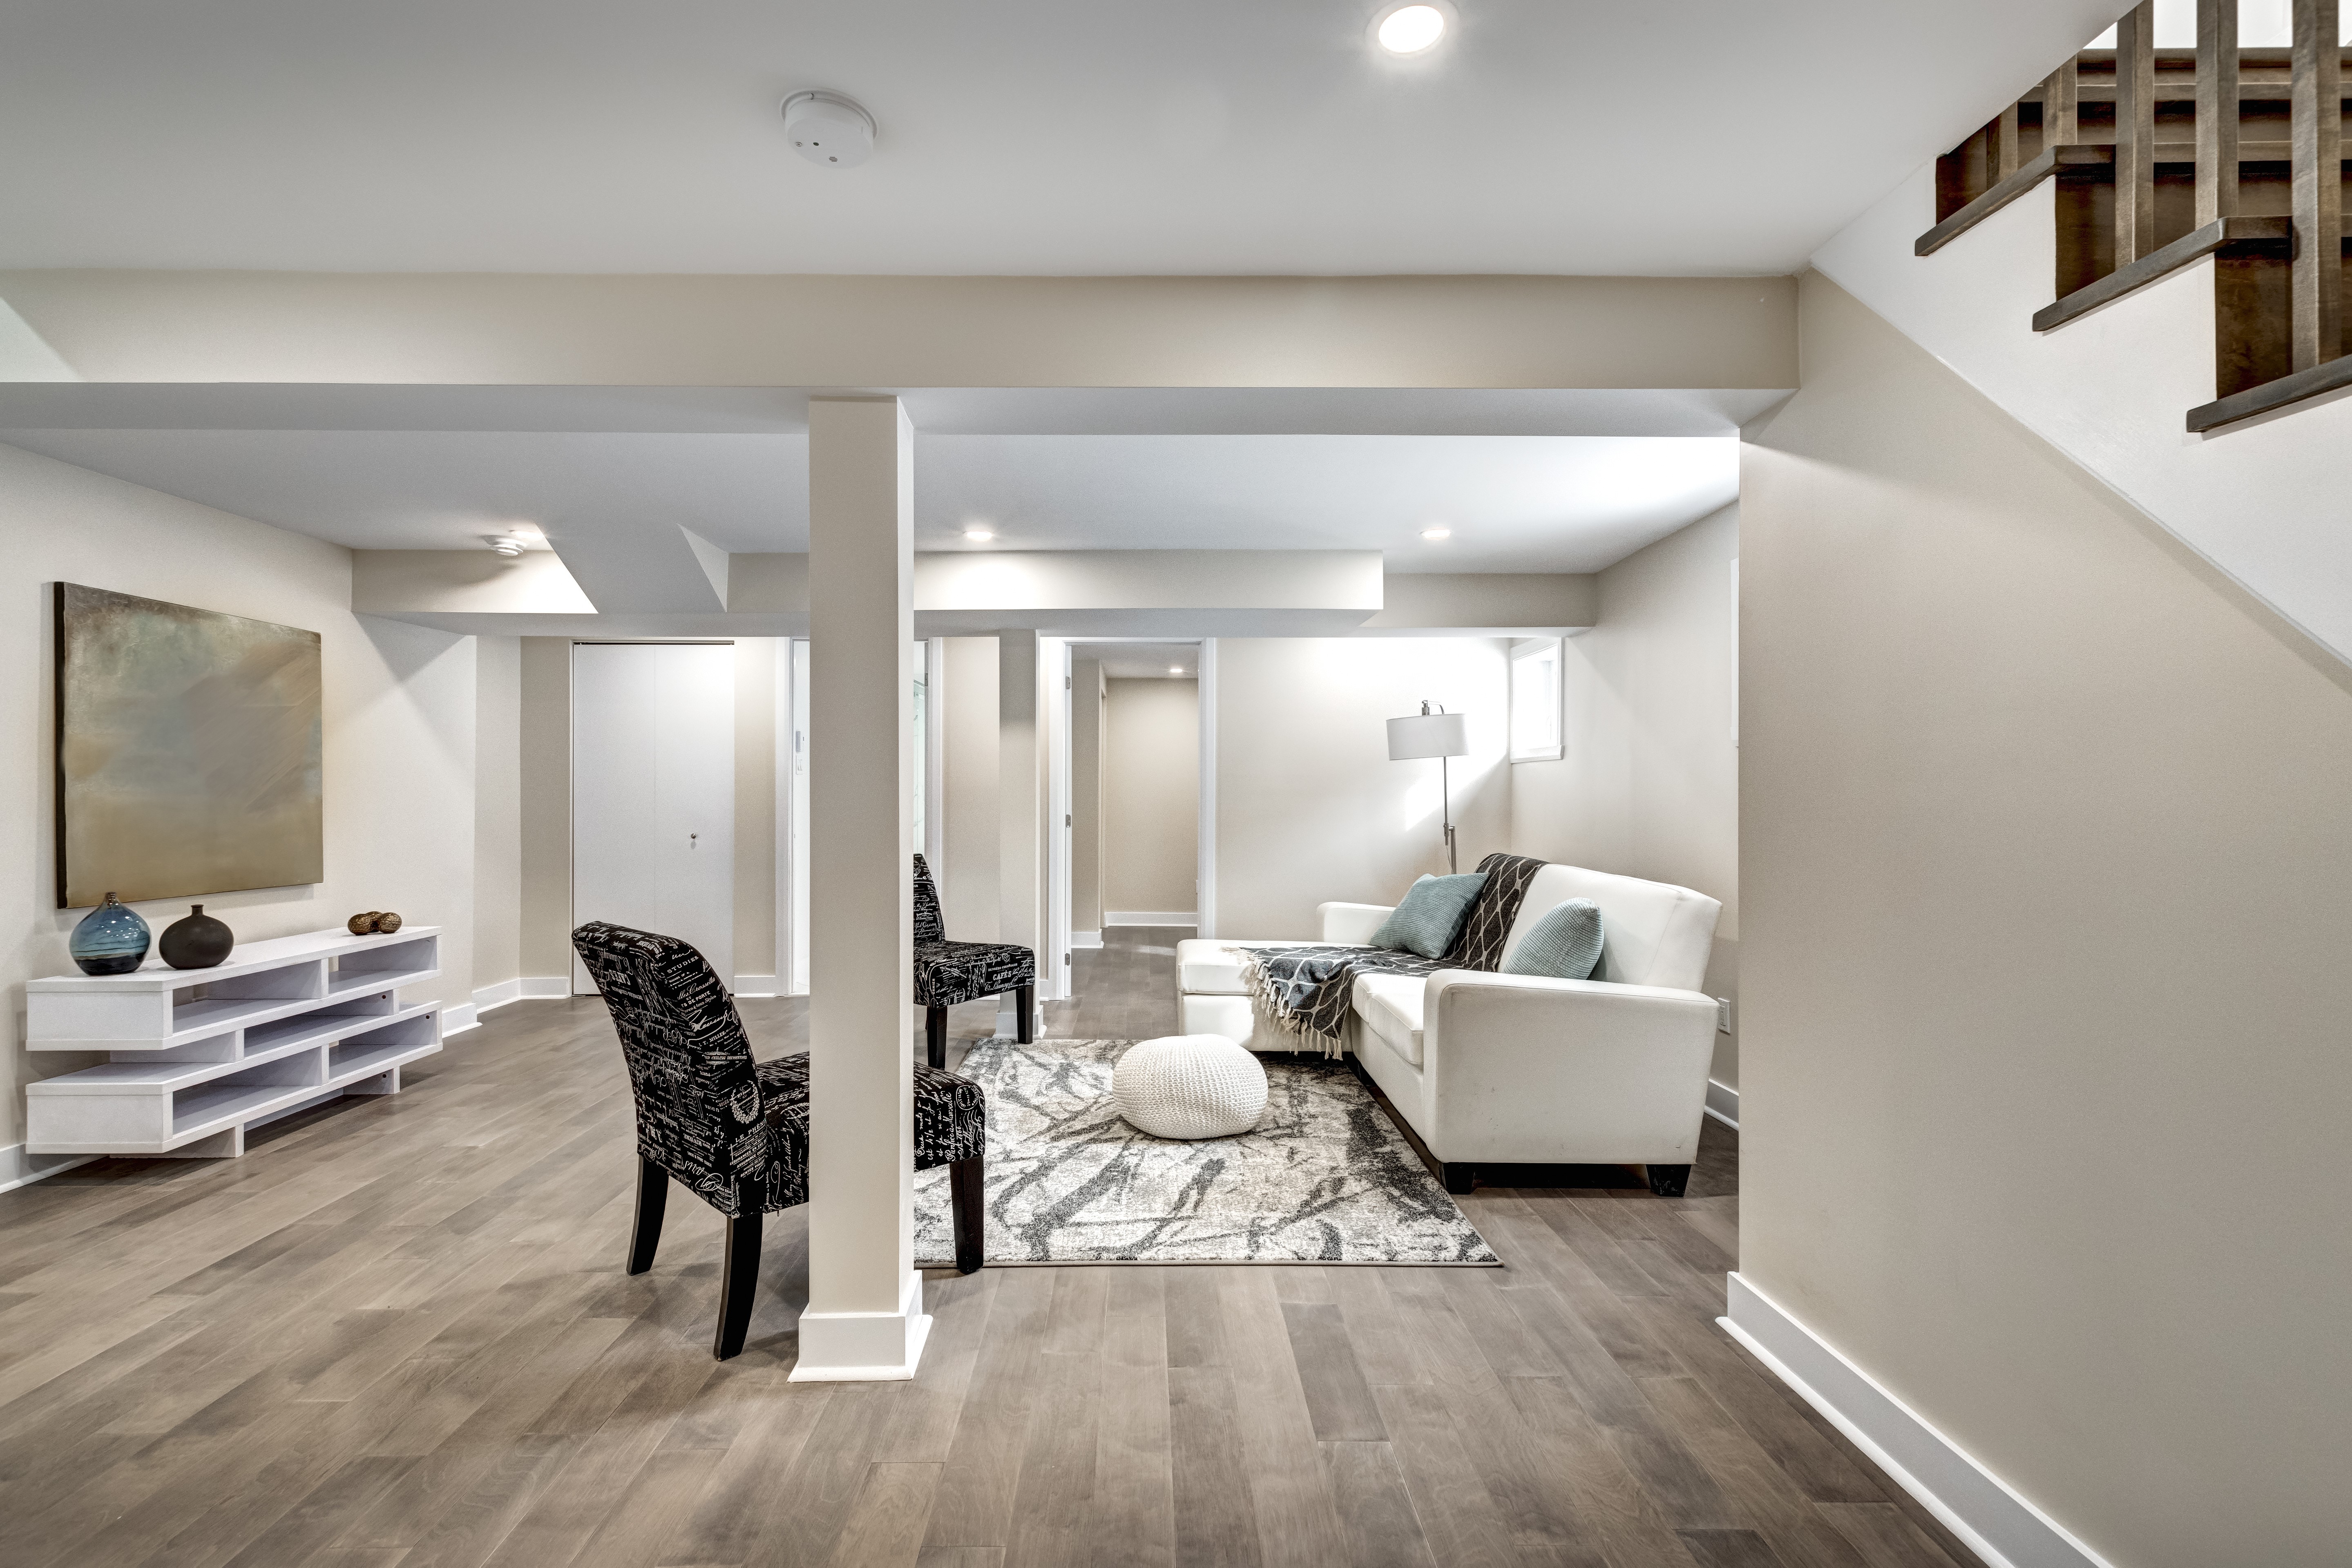
Adding drywall, insulation, paint, flooring, and subflooring to a 50x20-foot basement and adding a 5x4-foot half bathroom.
$0
$0
0%